Download
1 / 30
300 likes | 375 Views
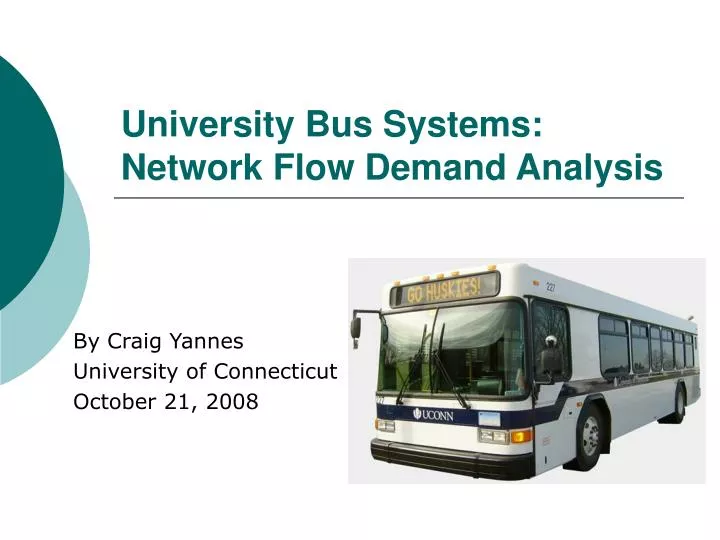
University Bus Systems: Network Flow Demand Analysis. By Craig Yannes University of Connecticut October 21, 2008. Introduction. University bus systems are an important form of transportation around university campuses

E N D
University Bus Systems: Network Flow Demand Analysis By Craig Yannes University of Connecticut October 21, 2008
Introduction • University bus systems are an important form of transportation around university campuses • Research has shown that these systems generate more ridership than their counterparts (Daggett and Gutkowski, 2005) • University enrollment has also been expanding
Problem • The sharp increase in demand has put a strain on university resources to provide an effective bus system • Many routing design decisions have been made subjectively • This results in an inefficient system, which leaves demand centers unidentified, underserved or unserved
Solution • Network flow theory, in conjunction with spatial analysis (GIS), can help remove the subjectivity from university bus system design • Focus of this project is the selection of optimal stopping locations considering operational cost while serving the maximum passengers (demand)
Goals • Create a simple and efficient model framework to analyze the coverage of a university bus system • Analyze the effects of stopping service areas (walk distance to stop) on the selection of optimal stopping locations
Objectives • Collect and generate transportation link and transit demand data • Generate and analyze demand data to create centers which will serve as potential bus stops • Create a network flow model representation and use an appropriate solution technique, yielding the optimal demand centers to be served by the bus system at differing service areas
Background • The following have utilized network flow algorithms and theory to solve transit design (routing, scheduling, frequency, etc.) problems: • Ceder and Wilson (1986) • Chu and Hobeika (1979) • Ranjithan, Singh and Van Oudheusden (1987) • LeBlanc (1988) • Kocur and Hendrickson (1982) • Kuah and Perl (1985)
Background • Overall transit design involves two interest groups (passenger and operator) • Depending on the component being designed, the focus shifts between these groups • This proposed research will focus solely on operator costs while attempting to serve the maximum amount of passengers
Background • Furth, Mekuria and SanClemente (2007) created and used GIS applications to analyze the spacing of transit stops based on the street network and parcel data • The study evaluated walking, riding and operating costs when stops were reconfigured from the existing placement • Similar to this research except that no network flow theory was used
Nodes representing potential stopping locations Supply Node (Bus Depot) Supply = Number of demand nodes Destination nodes which are spread throughout the exterior of the network to pull flow in all directions Demand = 1 for each node Arcs leading to accessible nodes based on current location Cost on Links is a function of distance and demand Network Representation The following design was used to create a network representation of the bus system:
Data • Connecticut Department of Environmental Protection: Connecticut Street Network Shapefile (1:100,000) • 2006 UConn personal geodatabase which included street, building and parking lot feature classes
Demand • Calculated using ITE Trip Generation Manual • Produces auto trips based on the building/area purpose and attributes such as area, number of seats and number of units • Although this research focuses on transit trips, the auto trips can be used to determined relative demand between locations
Potential Stopping Locations • 32 Locations were selected at points along the roadway near key intersections and large generators • The demand at each one of these stops is equal to the sum of demand of the buildings and parking lots within a particular distance (1/8, 1/4, 1/2 mile) of the stopping location • 5 destination locations were also selected such that the flow would be spread around the network evenly
Link Generation between Stops • Links represent the transportation path between two stops though it does not follow street layout directly • The following rules were used to create the links between the stops: • Links must proceed in a forward progression (must be getting closer to a destination) • Links cannot pass through stops • Stops on the exterior must connect with sink locations
Link Cost • Combination of two factors • Distance between stops • Demand at the ending stop • Because higher demand should incur less cost the inverse demand was used • This requires a scaling factor so that demand values are comparable in magnitude to distance
Solution Technique • A geometric network was created in GIS weighted with the calculated link cost • The Network analyst toolset in ArcGIS was used to find the shortest path between the source node and each of the 5 sink nodes • The nodes that lie on these shortest paths are the optimal stopping locations
Conclusions • A model framework has been created which analyzes a bus network yielding optimal stopping locations • Increasing the service area, reduces the distance traveled and increases that amount of unique stops served by the system • Planners must be cautious when trying to balance ridership and efficiency • Analyzing the system for different service areas can help quantify this relationship and create a more efficient system
Future Research • Expand the analysis area to include other locations surrounding the campus • Acquire or generate more accurate demand data • Comparison / application to the existing bus system • Incorporate the effect of larger service areas on demand • Create similar network frameworks that focus on the other aspects of bus system design
References • Daggett J. and Gutkowski R. (2003). University Transportation Survey: Transportation in University Communities. Colorado State University. • Sutton J. C. GIS Applications in Transit Planning and Operations: A Review of Current Practice, Effective Applications and Challeneges in the USA. Transportation Planning and Technology, Vol. 28, 2005, pp. 237-250. • Furth P. G., Mekuria M. and SanClemente J. Stop-spacing Analysis Using GIS Tools with Parcel and Street Network Data. Presented at 86th Annual Meeting of the Transportation Research Board, Washington, D.C., 2007. • Ceder A. and Wilson N. H. M.. Bus Network Design. Transportation Research Part B, Vol. 20B, 1986, pp. 331-344. • Chu C. and A. G. Hobeika. In Transportation Research Record: Journal of the Transportation Research Board, No.730, Transportation Research Board of the National Academies, Washington, D.C., 1979, pp. 7-13. • Institute of Transportation Engineers (ITE). Trip Generation, 6th ed., Washington, D.C., 2003. • Kocur G. and Hendrickson C. Design of Local Bus Service with Demand Equilibrium. Transportation Science, Vol. 16, 1982, pp.149-170. • Kuah G. K. and Perl J. A methodology for feeder bus network design. In Transportation Research Record: Journal of the Transportation Research Board, No.1120, Transportation Research Board of the National Academies, Washington, D.C., 1985, pp. 40–51. • LeBlanc L. J. (1988). Transit system network design. Transportation Research Part B, Vol. 22B,1988, pp.383-390. • Ranjithan S., Singh K. N., and Van Oudheusden D. L. The Design of Bus Route Systems – An Interactive Location-Allocation Approach. Transportation, Vol. 14, 1987, pp.253-270.
References • GIS Data • Connecticut Department of Environmental Protection http://www.ct.gov/dep/cwp/view.asp?a=2698&q=322898 • Richard Mrozinski, University of Connecticut Department of Geography • Images • Title: http://www.park.uconn.edu/ • Problem: http://www.news.com.au/dailytelegraph/story/0,22049,2 1265300-5011906,00.html • Background: www.caliper.com/UK/transcad.htm • Questions: http://www.pritchettcartoons.com/newcar2.htmhttp://home.fuse.net/ard/jandress/transfuture3.jpg