Download
1 / 43
810 likes | 1.61k Views
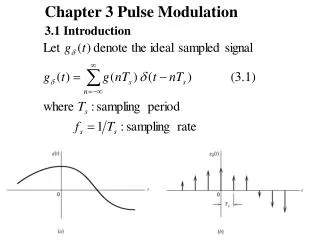
Chapter 4: Bandpass Modulation and Demodulation/Detection. 4.1 Why Modulate?. 4.1 Why Modulate?. Digital modulation : digital symbol : waveform compatible with the characteristic of the channel Why use carrier? ⓐ reduce size of antenna ( = 3 10 8 m/f c )

E N D
4.1 Why Modulate? • Digital modulation : digital symbol : waveform compatible with the characteristic of the channel • Why use carrier? ⓐ reduce size of antenna (=3108m/fc) e.g.) fc = 3kHz : antenna span : /4 = 25km fc = 900 MHz : antenna diameter : /4 = 9cm ⓑ frequency-division multiplexing ⓒ minimize the effect of interference : spread spectrum ⓓ place a signal in a frequency band where design • requirements are met (e.g.)RF->IF
4.2 Digital Bandpass Modulation Technique General form of a carrier wave 4.2.1 Phasor Representation of a Sinusoid complex notation of a sinusoidal carrier wave
4.2 Digital Bandpass Modulation Technique • Analytical form of transmitted waveform • Analytical representation of narrowband FM(NFM)
4.2.2 Phase Shift Keying 4.2.3 Frequency Shift Keying 4.2.4 Amplitude Shift Keying 4.2 Digital Bandpass Modulation Technique
4.3.1 Decision Regions Two-dimensional signal space (M=2) • Detector decides which of the signals s1 or s2 was transmitted, after receiving r =>Minimum-error decision rule chooses the signal class s.t. distance is minimized • Decision region • Decision rule 4.3 Detection of signals in Gaussian Noise
4.3.2 Correlation Receiver • Received signal • Detection process Step 1 : Transform the waveform r(t) into a single random variable(R.V.) Matched filter (Correlator) maximizes SNR • Another detection approach (Fig.4.7.(b)) Any signal set can be expressed in terms of some set of basis functions 4.3 Detection of signals in Gaussian Noise Step 2 : Choose waveform si(t) that has the largest correlation with r(t) Choose the si(t) whose index corresponds to the max Zi(T)
4.3 Detection of signals in Gaussian Noise Signal N symbol M Signal N< symbol M Ex) M-ary PSK N=2
4.3 Detection of signals in Gaussian Noise 4.3.2.1 Binary Detection Threshold • Decision stage : choose the signal best matched to the coefficients aij (with the set of output Zj(T))
Two conditional pdfs : likelihood of s1(s2) 4.3 Detection of signals in Gaussian Noise
4.3 Detection of signals in Gaussian Noise • Minimum error criterion for equally likely binary signals corrupted by Gaussian noise • For antipodal signals,
4.4.1Coherent Detection of PSK(BPSK) • Coherent detector • BPSK example • Orthonormal basis function 4.4 Coherent Detection
4.4 Coherent Detection 4.4.1Coherent Detection of PSK(BPSK) • When s1(t) is transmitted, the expected values of product integrator • Decision stage Choose the signal with largest value of zi(T)
4.4.2 Sampled Matched Filter • Example 4.1 Sampled Matched Filter Consider the BPSK waveform set Illustrate how a sampled matched filter or correlator can be used to detect a received signal, say s1(t), from the BPSK Waveform set, in the absence of noise. Sampled MF (N samples per symbol)
4.4 Coherent Detection Ex) Sampled MF (4 samples per symbol) sampled s1 sampled s2
4.4 Coherent Detection 4.4.3 Coherent Detection of Multiple Phase Shift Keying • Signal space for QPSK(quadri-phase shift keying), M=4 (N=2) • For typical coherent MPSK system, • Orthonormal basis function
Signal can be written as • Received signal • Demodulator 4.4.3 Coherent Detection of Multiple PSK decision
Typical set of FSK signal waveforms • Orthonormal set • Distance between any two prototype signal vectors is constant • The ith prptotype signal vector is located on the ith coordinated axis a displacement from origin 4.4.4 Coherent Detection of FSK
4.4 Coherent Detection • Example:3-ary FSK signal
4.5.1 Detection of Differential PSK • Non-coherent detection : actual value of the phase • of the incoming signal is not required • For coherent detection, MF is used • For non-coherent detection, this is not possible because MF • output is a function of unknown angle α 4.5 Non-coherent Detection
Differential encoding : information is carried by • the difference in phase between two successive • waveforms. To sent the i-th message (i=0,…,M), • the present signal must have its phase advanced by • over the previous signal • Differential coherent detection : non-coherent because • it does not require a reference in phase with received • carrier Assuming that αvaries slowly relative to 2T, • phase difference is independent of α as 4.5.1 Detection of Differential PSK
4.5.1 Detection of Differential PSK • DPSK Vs. PSK • DPSK : 3dB worse than PSK • PSK compares signal with clean reference • DPSK compares two noisy signals, • reducing complexity
4.5.2 Binary Differential PSK Example Sample index k Original message encoder Differential message Correspondng phase 1 Arbitrary setting decoder
4.5 .3 Non-coherent Detection of Binary Differential FSK • Just an energy detector without phase measurement • Twice as many channel branches • Quadrature receiver
4.5 .3 Non-coherent Detection of Binary Differential FSK • Three different cases : • Another implementation for • non-coherent FSK detection • Envelop detector : • rectifier and LPF • Looks simpler, but (analog) • filter require more complexity
Minimum tone separation:1/T[Hz] 4.5.4 Required Tone Spacing for Non-coherent Orthogonal FSK Signaling • In order for the signal set to be orthogonal, any • pair of adjacent tones must have a frequency • separation of a multiple of 1/T[Hz] cf) Nyquist filter
⊙ Non-coherent FSK signal : ⊙ Coherent FSK signal : 4.5 Non-coherent Detection : Example 4.3 Non-coherent이면 둘 다 0이어야 함
4.7 Error Performance for Binary Systems 4.7.1Probability of Bit Error for Coherently Detected BPSK • Antipodal signals • Basis function • Decision rule is
4.7 Error Performnace for Binary Systems The same a priori probability a1 a2
4.7 Error Performance for Binary Systems • Another approach (1)
4.7 Error Performance for Binary Systems • Another approach (2) BPSK BFSK s2 s2 s1 s1
Modulation PB PSK(coherent) DPSK (dfferentially coherent) Orthogonal FSK (coherent) Orthogonal FSK (noncoherent) 4.7 Error Performance for Binary Systems • Probability of bit error for several types of binary systems TABLE 4.1 Probability of Error for Selected Binary Modulation Schemes
4.8 M-ary Signaling and Performance 4.8.2 M-ary Signaling(M=2k k:bits, M=# of waveforms) M-ary orthogonal k↑ BER↑ BW↑ ① M-ary PSK k↑ BER↑ same BW Shannon Limit -1.6dB k=∞ ② (R, Eb/No, BER, BW) : fundamental “trade-off”
4.8.3 Vectorial View of MPSK Signaling ① (M=2k↑, the same Eb/No) bandwidth efficiency (R/W) ↑, PB ↑ ② (M=2k↑, the same PB) bandwidth efficiency (R/W) ↑, Eb/No ↑
4.8.4 BPSK and QPSK : the same bit error probability • General relationship • QPSK = two orthogonal BPSK • channel (I stream, Q stream) BPSK QPSK
4.8 M-ary Signaling and Performance • If original QPSKis given by R[bps], S[watt], Same BER, BW efficiency : BPSK=1,QPSK=2[bit/s/Hz] • Eb/N0 vs. SNR
4.8 M-ary Signaling and Performance • Fig. 4.34 : M-ary orthogonal signaling at PE=10-3 in dB(decibel, nonlinear), factor(linear) k=10 (1024-ary symbol), 20SNR(factor)→2SNR per bit(factor); each bit require 2.
4.9 Symbol Error Performance for M-ary System(M>2) 4.9.4 Bit Error Probability vs. Symbol Error Probability for Multiple Phase Signaling • Assume that the symbol(011) is transmitted If an error occur, (010) or (100) is likely→3bit errors • Gray code : neighboring symbols differ from one another in only one bit position • BPSK vs. QPSK