Download
1 / 7
70 likes | 143 Views
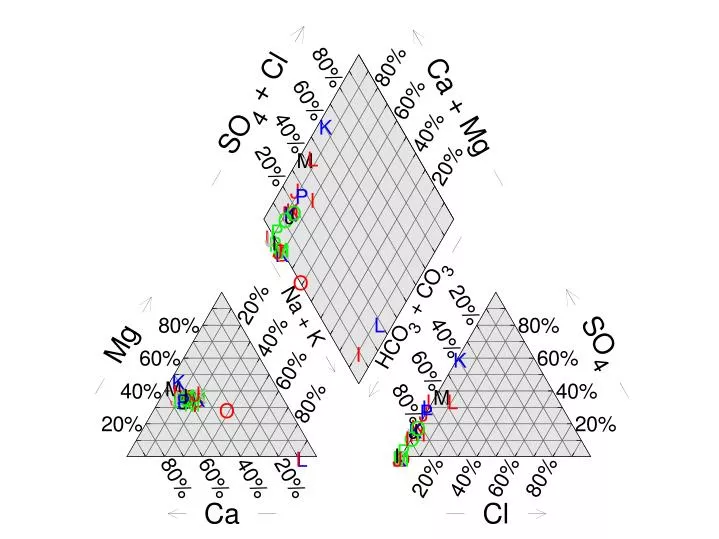
Enter chemical data for one or more samples, then click on Graphs and choose from a number of diagrams. Graphs → Piper Diagram. A Piper Diagram shows the fluid's major ion composition. A Durov Diagram shows the fluid's major ion composition, pH, and TDS.

E N D
Enter chemical data for one or more samples, then click on Graphs and choose from a number of diagrams. Graphs → Piper Diagram
A Piper Diagram shows the fluid's major ion composition.
A Durov Diagram shows the fluid's major ion composition, pH, and TDS.
A Stiff Diagram represents the fluid's major ion composition as a polygonal shape.
An ion balance diagram (Bar Chart) represents the fluid's cation-anion balance graphically.