Download
1 / 11
110 likes | 243 Views
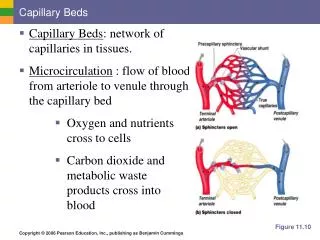
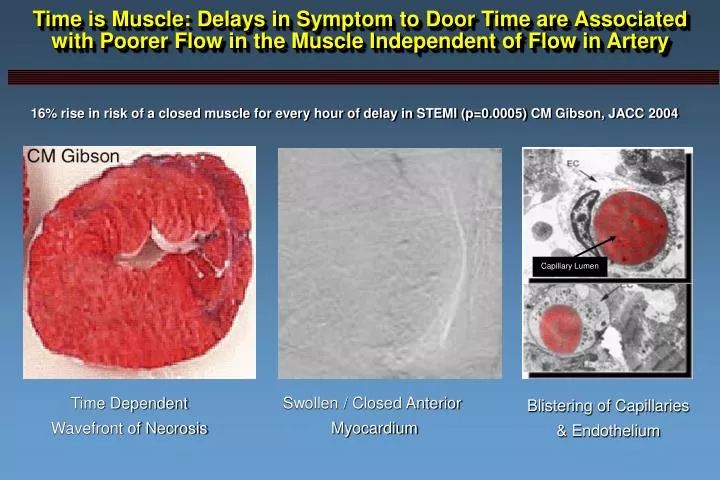
Capillary Lumen. Time is Muscle: Delays in Symptom to Door Time are Associated with Poorer Flow in the Muscle Independent of Flow in Artery. 16% rise in risk of a closed muscle for every hour of delay in STEMI (p=0.0005) CM Gibson, JACC 2004. Swollen / Closed Anterior Myocardium.

E N D
Capillary Lumen Time is Muscle: Delays in Symptom to Door Time are Associated with Poorer Flow in the Muscle Independent of Flow in Artery 16% rise in risk of a closed muscle for every hour of delay in STEMI (p=0.0005) CM Gibson, JACC 2004 Swollen / Closed Anterior Myocardium Time Dependent Wavefront of Necrosis Blistering of Capillaries & Endothelium
Delay in Time from Symptom Onset to Treatment and TIMI Myocardial Perfusion Grade at 60 minutes For impaired tissue perfusion, MV OR 1.16 per hour of delay p = 0.003 p = 0.014 25th/75th Percentile 2.2 / 4.05 25th/75th Percentile 2 / 3.75 Time from sx onset to treatment (hrs) % TMPG 2/3 n=625 n=258 n=549 n=916 Time to treatment >4 hours Time to treatment 4 hours TMPG 2/3 TMPG 0/1 Gibson CM, J Am Coll Cardiol 2004
Delay in Time from Symptom Onset to Treatment and TIMI Flow Grade at 60 minutes p < 0.001 p < 0.001 25th/75th Percentile 2.3 / 4.6 % TFG 2/3 25th/75th Percentile 2 / 3.9 Time from sx onset to treatment (hrs) n=1,870 n=614 n=545 n=1,801 Time to treatment >4 hours Time to treatment 4 hours TFG 2/3 TFG 0/1 Gibson CM, J Am Coll Cardiol 2004
Delay in Time from Symptom Onset to Treatment and Corrected TIMI Frame Count at 60 minutes p = 0.001 25th/75th Percentile 27.6 / 100 25th/75th Percentile 25 / 100 Corrected TIMI Frame Count (frames) n=583 n=1,679 Time to treatment >4 hours Time to treatment 4 hours Gibson CM, J Am Coll Cardiol 2004
Delay in Time from Symptom Onset to Treatment and Myocardial Blush on Digital Subtraction Angiography p = 0.02 25th/75th Percentile 3.5 / 12.6 25th/75th Percentile 2.9 / 11 Blush Brightness on DSA (gray scale) n=213 n=745 Time to treatment >4 hours Time to treatment 4 hours Gibson CM, J Am Coll Cardiol 2004
Delay in Time from Symptom Onset to Treatment and Ejection Fraction and Collaterals p < 0.0001 p = 0.004 Collaterals (%) Ejection fraction (%) n=495 n=930 n=1,360 n=2,546 Time to treatment >4 hours Time to treatment >4 hours Time to treatment 4 hours Time to treatment 4 hours Gibson CM, J Am Coll Cardiol 2004
Delay in Time from Symptom Onset to Treatment and TIMI Flow Grade post-PCI p = 0.005 p = 0.007 25th/75th Percentile 2.1 / 5 % Post-PCI TFG 3 25th/75th Percentile 2 / 4.1 Time from sx onset to treatment (hrs) n=1,187 n=379 n=202 n=1,010 Time to treatment >4 hours Time to treatment 4 hours Post-PCI TFG 3 Post-PCI TFG 0/1/2 Gibson CM, J Am Coll Cardiol 2004
Delay in Time from Symptom Onset to Treatment and Corrected TIMI Frame Count post-PCI p = 0.008 25th/75th Percentile 17 / 37 25th/75th Percentile 16 / 32 Post-PCI Corrected TIMI Frame Count (frames) n=290 n=796 Time to treatment >4 hours Time to treatment 4 hours Gibson CM, J Am Coll Cardiol 2004
Delay in Time from Symptom Onset to Treatment and TIMI Myocardial Perfusion Grade post-PCI p = 0.017 p = 0.33 25th/75th Percentile 2.1 / 4 25th/75th Percentile 1.9 / 3.75 % Post-PCI TMPG 2/3 Time from sx onset to treatment (hrs) n=315 n=150 n=330 n=495 Time to treatment >4 hours Time to treatment 4 hours Post-PCI TMPG 2/3 Post-PCI TMPG 0/1 Gibson CM, J Am Coll Cardiol 2004
Relationship Between Time to Reperfusion, ST-Segment Resolution, Myocardial Blush Scores and Mortality With Primary Percutaneous Coronary Intervention for Acute Myocardial Infarction: Results from the CADILLAC Trial • The CADILLAC Trial randomized 2,082 pts with AMI to PTCA vs. stenting +/- abciximab • Complete STR was associated with a higher frequency of MB (56% vs. 40%, p=0.0007) • 40% of pts with poor STR had good blush scores • 44% of pts with complete STR had poor blush scores • One year mortality was lowest with optimum microvascular reperfusion (complete STR and Grade 2/3 MB) and highest with poor microvascular reperfusion (0.6% vs. 9.9%, p=0.006) *Defined as >70% Conclusion:Early time to reperfusion is associated with a greater likelihood of successful microvascular reperfusion after primary PCI. Brodie et al, ACC 2004
Time-to-treatment and myocardial blush Time-to-treatment was significantly associated with extent of ST-segment resolution, myocardial blush grade, enzymatic infarct size, and 1-year mortality Time-to-treatment remained associated with impaired ST-segment resolution (adjusted OR 1.01 [1.01–1.02], p < 0.001) and myocardial blush (adjusted OR 1.01 [1.01–1.02], p < 0.0001) in a MV model Eur Heart J. 2004 Jun;25(12):1009-13