Download
1 / 15
150 likes | 275 Views
Health Expenditures, Longevity, and Growth by Dormont, Martins, Pelgrin, Suhrcke Discussion by Axel Börsch-Supan Mannheimer Forschungsinstitut „Economics of Aging“ (MEA) Fondazione RDB, Limone sul Garda, 26. May 2007. Stucture of the Epos. EconomicGrowth (5.3, 5.4). Income (3).

E N D
Health Expenditures, Longevity, and Growth by Dormont, Martins, Pelgrin, Suhrcke Discussion by Axel Börsch-Supan Mannheimer Forschungsinstitut „Economics of Aging“ (MEA) Fondazione RDB, Limone sul Garda, 26. May 2007
Stucture of the Epos EconomicGrowth (5.3, 5.4) Income (3) Volume of Health Care (2.2) Health Care Expenditures (2.1) Aging (2.2.1) Health Status, Longevity (1) Pro-ductivity (5.2) Economic Incentives (2.3.4) Techno-logical Change (2.2) Prices of Health Care (2.3.3) Regu-lation (2.3.4) Value of Life and Health (2.4) Expenditure Projections (4) (2.4.4: Optimal health care spending) ...an Epos is never straight
Human capital and health stock are complements. Important for policy! 1. Health as Investment EconomicGrowth (5.3, 5.4) Income (3) Measurement of HALE Volume of Health Care (2.2) Health Care Expenditures (2.1) Health Status, Longevity (1) Pro-ductivity (5.2) Education Behavior Longevity indexation(„real and nominal age“) strengthens investment point of view
„Real age“ „Nominal age“ Germany, using „Official Population Projection Mark 10“ Source: Börsch-Supan and Reil-Held (2004) Do not use demographic dep. ratioUse SYSTEM dependency ratio!
Socio-cultural reporting style => Do not rely on self-reported measures! Mannheim Research Institute for the Economics of Aging SPC-ISG 25.Jan.2006
Socio-Economic Gradient by education: by income: Mannheim Research Institute for the Economics of Aging SPC-ISG 25.Jan.2006
Socio-Economic Gradient: Detailed picture by education • Alzheimer • Obesity Mannheim Research Institute for the Economics of Aging SPC-ISG 25.Jan.2006
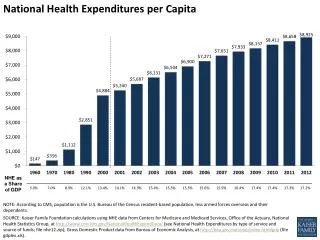
2. OECD Expenditure Projections Income (3) Volume of Health Care (2.2) Health Care Expenditures (2.1) Health Status, Longevity (1) • Death-related expenditures • Babyboom effects • Compression of morbidity • Income elasticity • Why does the latter matter? Expenditure Projections (4)
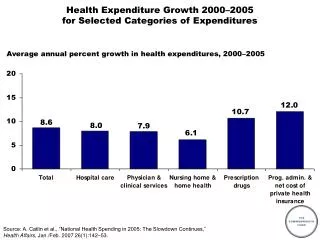
Substitution and extension: Product and process innovation 3. Causes for Rising Health Care Expenditures EconomicGrowth (5.3, 5.4) Income (3) Volume of Health Care (2.2) Health Care Expenditures (2.1) Aging (2.2.1) Health Status, Longevity (1) Pro-ductivity (5.2) Economic Incentives (2.3.4) Techno-logical Change (2.2) Prices of Health Care (2.3.3) SystemEfficiencyGovernance Regu-lation (2.3.4) Expenditure Projections (4) Contribution to causes: Weak extrapolation base
3. Health expenditures (%GDP) and healthy life expectancy: efficiency??? Input Output Source: OECD 2005WHO 2006
Variance decomposition 8.9% 1.2% 2.2% 87% which is not health, age or gender Mannheim Research Institute for the Economics of Aging SPC-ISG 25.Jan.2006
Health and Early Retirement Mannheim Research Institute for the Economics of Aging
4. Optimal health care spending EconomicGrowth (5.3, 5.4) Income (3) Volume of Health Care (2.2) Health Care Expenditures (2.1) Health Status, Longevity (1) Pro-ductivity (5.2) Economic Incentives (2.3.4) Techno-logical Change (2.2) Prices of Health Care (2.3.3) Regu-lation (2.3.4) Value of Life and Health (2.4) Expenditure Projections (4) Too what? Too much: supply induced demand Too little: VSL calculation (2.4.4: Optimal health care spending)
Health Expenditures, Longevity, and Growth • by Dormont, Martins, Pelgrin, Suhrcke • Very interesting and inspiring epos • Many issues – so many quibbles… • Keep pushing empirical health economics, push data limits!