Download
1 / 8
80 likes | 188 Views
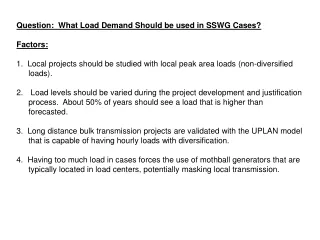
SSWG Load Forecast Review Methodology. Kevin Hanson. SSWG Load Forecast Review. The SSWG case is consistently higher than the adjusted CDR data. ERCOT staff has been investigating into the cause of this difference. Current Data Available.

E N D
SSWG Load Forecast Review Methodology Kevin Hanson RPG Meeting
SSWG Load Forecast Review • The SSWG case is consistently higher than the adjusted CDR data. • ERCOT staff has been investigating into the cause of this difference. RPG Meeting
Current Data Available • ERCOT staff has looked at multiple data sources available to investigate what is contributing to this difference. • FERC 714 (data from 1993 to 2000) • Control Area NCP • Control Area load at ERCOT CP • ALDR report (data from 2001 to 2008) • Bus level NCP (excluding losses and UFE) • Bus level load during ERCOT system CP (excluding losses and UFE) • Market settlements (2004 to 2008): • TDSP NCP (including losses and UFE) • TDSP load at ERCOT CP (including losses and UFE) RPG Meeting
Possible Reasons – One year bump in loads (2008 to 2009) • One year increase in total coincident peak for the seven largest TSPs in approximately 5,400 MW • There exists an argument of 2007 and 2008 being relatively cool which justifies bump • If you assume 2006 to 2009 annual average growth rate of 2%, load for these seven TSPs would only increase approximately 3,300 MW while the underlying ALDR data increases approximately 5,200 MW for that same time period (difference of 1,900 MW) • One year bumps also occurred in the 2007 and 2008 ALDRs RPG Meeting
Possible Reasons – Load forecasts from 2009 to 2015 • The seven largest TSPs’ aggregate load forecasts increase 2.15% • Two of these seven TSPs’ coincident peak forecasts is above 4.50% • If these 2 market participants coincident peak forecasts were only 2%, their combined load forecast by 2015 would be reduced approximately 2,300 MW RPG Meeting
Possible Reasons – Non-coincident peak ratio • ALDR data (bus level NCP) from 2001 to 2008 shows about 7.6% non-coincident to coincident peak ratio • Market settlement NCP to CP (TDSP NCP) ratio from 2004 to 2008 is 3.60% • The NCP to CP ratio is 4.30% from 2009 to 2015 in the ALDR data which is bus level NCP • The 0.7% difference is probably about a 500 to 600 MW impact RPG Meeting
Summary • Multiple TDSPs are assuming much larger CP load growth over the next 7 years (13,300 MW) than existed the past 8 years (5,300 MW) • ERCOT is attempting to understand the load forecasting process utilized by the TDSPs • We are trying to develop understanding of any inconsistencies in the levels of load included by each TDSP and we have talked to some already. • Is the one year bump up too high from 2008 to 2009 when 2009 is in a recession; is it even driven by economic or something else? • What level of coincidence consistency should be used? Bus level, TDSP level, or ERCOT coincident peak? • Looking at the historical data, is the load forecast too high? RPG Meeting
Questions? RPG Meeting