Download
1 / 46
460 likes | 696 Views
Central Tendency. Introduction to Statistics Chapter 3 Sep 1, 2009 Class #3. Central Tendency. A statistical measure to determine a single score that defines the center of the distribution There are many measures of central tendency. The most common are the mean, median, and mode.

E N D
Central Tendency Introduction to Statistics Chapter 3 Sep 1, 2009 Class #3
Central Tendency • A statistical measure to determine a single score that defines the center of the distribution • There are many measures of central tendency. The most common are the mean, median, and mode
MEASURES OF CENTRAL TENDENCY • The Mode • The Median • The Mean • The Symmetrical Distribution • The Positively Skewed Distribution • The Negatively Skewed Distribution
Mode: The Category or Score with the Largest frequency(or %) • The mode is always a category or score • The mode is not necessarily the category with the majority(more than 50% of the cases) • The mode is the only measure of central tendency for nominal variables • Some distributions are bimodal
Mode is the category with highest frequency (not necessarily the majority)
Bimodal Distribution • Bimodal distribution is a continuous probability distribution with two different modes. These appear as distinct peaks. See below:
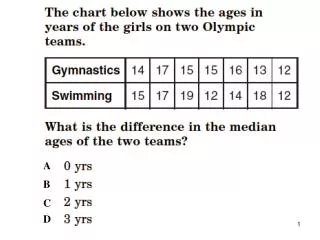
THE MEDIAN • The median is a measure of central tendency for variables which are at least ordinal • The median represents the exact middle of a distribution • It is the score that divides the distribution into two equal parts
Finding the Median in sorted data “How satisfied are you with your health insurance? Responses of 7 Individuals very dissatisfied very satisfied somewhat satisfied very dissatisfied somewhat dissatisfied somewhat satisfied very satisfied Total (N) 7
To locate the median Arrange the responses in order from lowest to highest (or highest to lowest): Response very dissatisfied very dissatisfied somewhat dissatisfied somewhat satisfied ( The middle case =Median) somewhat satisfied very satisfied very satisfied ______________________________________________________
Summary :Locating the Median with N=Odd • The median is the response associated with the middle case. • You find the middle case by :(N + 1) / 2 • Since N= 7, the middle case is the (7 + 1) / 2, or the 4th case • The response associated with the 4th case is “somewhat satisfied”. Therefore the median is: Somewhat satisfied.
To locate the median (N=Even) Suicide rates of cities 7.44, 10.00, 12.26, 12.61, 13.38, 14.11, 14.30, 14.78 The median is located halfway between the two middle cases. When the variable is interval we can average the two middle cases. Median = 12.61 + 13.38 = 12.99 2
Finding the Median in Frequency Distributions • Construct a cumulative percentage distribution • The observation located at the middle of the distribution is the one that has a cumulative percentage value equal to 50% • The median is the category associated with this observation
Look here Median 50th % included here
Locating Percentiles in a Frequency Distribution • A percentile is a score below which a specific percentage of the distribution falls (the median is the 50th percentile. • The 75th percentile is a score below which 75% of the cases fall. • The median is the 50th percentile: 50% of the cases fall below it • Another type of percentile :The quartile lower quartile is 25th percentile and the upper quartile is the 75th percentile
97th Percentile ACT SAT GRE 85th Percentile 50th Percentile
Locating Percentiles in a Frequency Distribution 25% included here 25th percentile 50% included here 50th percentile 80th percentile 80% includedhere
____________________________Mean. The arithmetic average obtained by adding up all the scores and dividing by the total number of scores.___________________________________
The Mean _________________________________________________________________The arithmetic average obtained by adding up all the scores and dividing by the total number of scores. Mean = M = X n _________________________________________________________________ __ X = the sum of all the x scores in the sample n = the number of observations in the sample
Finding the mean in a frequency distribution When data are arranged in a frequency distribution, we must give each score its proper weight by multiplying it by its frequency. We use the following formula to calculate the mean: __ X = fx n where __ X = the mean f X = a score multiplied by its frequency n = the total number of cases in the distribution
Weighted Mean • Often it is necessary to combine two sets of scores and then find the overall mean for the combined group • See formula: • X1 + X2… n1+ n2…
Changing a score… • Changing any score will change the mean
Introducing a new score or removing a score… • Will usually change the mean
Adding or subtracting a new score… • If you add (or subtract) a constant from each score then the mean will increase (or decrease) by that score
Multiplying or dividing by a constant… • Same thing here: • If you multiply of divide each score by a constant the mean will be effected in a similar manner
Selecting a measure of central tendency… • If it is at all possible, you should attempt to find all three measures of central tendency • However, if this is not possible, then there are situations in which the mean, median, and mode have their specific "advantages"
Choosing the mean… • The mean is ordinarily the preferred measure of central tendency • The mean presented along with the variance and the standard deviation is the "best" measure of central tendency for continuous data
Choosing the median… • There are some situations in which the mean is not the "best" measure of central tendency. In certain situations, the median is the preferred measure. These situations are as follows: • when you know that a distribution is skewed • when you believe that a distribution might be skewed • when you have a small number of subjects
Choosing the median… • The purpose for reporting the median in these situations is to combat the effect of outliers • Outliers affect the distribution because they are extreme scores
Choosing the mode… • The mode is rarely chosen as the preferred measure of central tendency • The mode is not usually used because the largest frequency of scores might not be at the center • The only situation in which the mode may be preferred over the other two measures of central tendency is when describing discrete categorical data • The mode is preferred in this situation because the greatest frequency of responses is important for describing categorical data
SymmetricalDistributions • A distribution is symmetrical if the frequencies at the right and left tails of the distribution are identical, so that if it is divided into two halves, each will be the mirror image of the other. • In a unimodal symmetrical distribution the mean, median, and mode are identical.
Almost Symmetrical Distribution Mean=13.4 Median=13.0
Skewed Distribution:Skewed DistributionFew extreme values on one side of the distribution or on the other. • Positively skeweddistributions: distributions which have one or a few extremely high values (Mean > Median) • Negatively skewed distributions: distributions which have one or a few extremely low values (Mean < Median)
Positively Skewed Distribution Mean=1.13 Median=1.0
Positively Skewed Distribution • Example: • Personal income is frequently positively skewed because there are fewer people with high income; therefore, studies on earnings often report median income. The mean tends to overestimate both the earnings of the most typical earner (the mode) and the earnings represented by the 50th percentile (the median).
Negatively Skewed Distribution Mean=3.3 Median=4.0
Choosing a Measure of Central Tendency • IF variable is Nominal.. • Mode • IF variable is Ordinal... • Mode or Median (or both) • IF variable is Interval-Ratio and distribution is Symmetrical… • Mode, Median or Mean • IF variable is Interval-Ratio and distribution is Skewed… • Mode or Median
Credits • http://www.uwm.edu/People/chava/centraltend.ppt • http://simon.cs.vt.edu/SoSci/converted/MMM/choosingct.html • http://www.cvgs.k12.va.us/DIGSTATS/main/descriptv/d_skewd.html