Download
1 / 19
190 likes | 358 Views
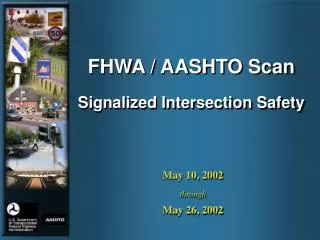
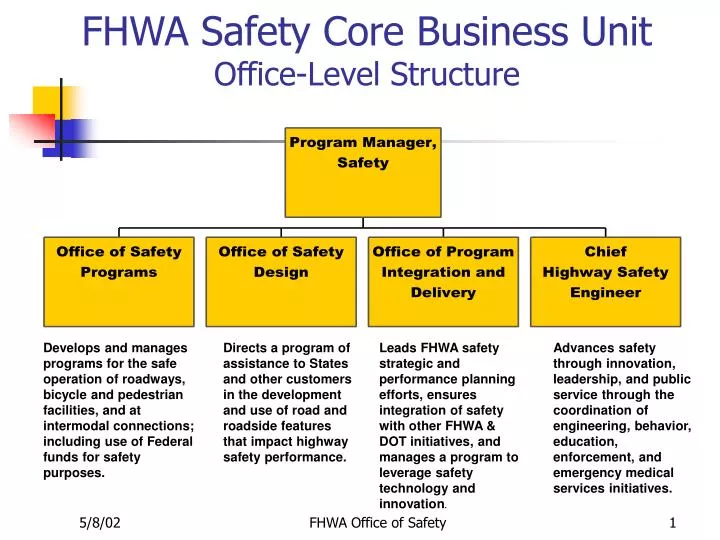
FHWA Safety Core Business Unit Office-Level Structure. Develops and manages programs for the safe operation of roadways, bicycle and pedestrian facilities, and at intermodal connections; including use of Federal funds for safety purposes.

E N D
FHWA Safety Core Business UnitOffice-Level Structure Develops and manages programs for the safe operation of roadways, bicycle and pedestrian facilities, and at intermodal connections; including use of Federal funds for safety purposes. Directs a program ofassistance to States and other customers in the development and use of road and roadside features that impact highway safety performance. Leads FHWA safety strategic and performance planning efforts, ensures integration of safety with other FHWA & DOT initiatives, and manages a program to leverage safety technology and innovation. Advances safety through innovation, leadership, and public service through the coordination of engineering, behavior, education, enforcement, and emergency medical services initiatives. FHWA Office of Safety
Highway Safety in the U.S. • U.S. Highway System Among World’s Safest • Fatality Rate Decreasing (as Traffic Increasing) • But over 41,000 Deaths & 3,200,000 Injuries per Year and rates of 1.52 • US DOT Safety Goals (FHWA, NHTSA, & FMCSA) • 20% Reduction in Highway deaths & injuries by 2008 • 50% Reduction in Large-Vehicle-Related deaths & injuries • FHWA Safety Program • Analyzes where fatalities & injuries occur • Looks for major contributing factors • Provides funding and program assistance for safety needs FHWA Office of Safety
Estimated Lives Saved in 2000(Using 1966 Fatality Rate & 2000 Traffic Volumes)*Avoided 109,405 Additional Deaths (70% less) Projected Fatalities (using 1966 Rate) * Actual Fatalities FHWA Office of Safety
Where Fatalities OccurBy Roadway Functional Class - 2000 data Number of Fatalities Fatality Rates (per 100 Million VMT) Interstate & Other Freeway Local Roads 7,358 7,718 8,698 18,047 Collectors Arterials Arterials Locals Interstate & Other Fwy Collectors FHWA Office of Safety
Where Fatalities Occur2000 data RURAL Fatalities by Roadway Functional Class RURAL & URBAN PERCENT Fatalities • LOCAL 19% • INTERSTATE RURAL 13% l 18,047 • ARTERIALS 38% • COLLECTORS 30% FHWA Office of Safety
What We Know About Crashes • 80% occur during normal weather conditions on dry roads • 70% occur during daylight hours • Fatalities: 61% Rural 39% Urban FHWA Office of Safety
Intersections • 21% of all Fatalities • 44% of all Crashes - 58% Urban - 42% Rural • Unsignalized Intersections - 55% of Urban Crashes - 90% of Rural Crashes FHWA Office of Safety
2 Lane Roads • 77% if all Fatalities (32,038) • 2/3 in Rural Areas • 2/3 during daylight hours • 1/4 intersection related • 1/6 Head-ons • 6/10 are single vehicle crashes FHWA Office of Safety
FHWA Focus AreasMajor Contributing Factors to Fatalities • Single Vehicle Run-Off-Road - 38 % • Speeding Related - 30 % • Intersections - 21 % • Pedestrian and Bicyclist - 13 % (Source: 2000 FARS data) FHWA Office of Safety
Run-Off-Road Crashes Crashworthy Devices Removing Roadside Hazards Improved Visibility Rumble Strips FHWA Office of Safety
Run Off Road • Safety Hardware • NCHRP 350 • National Crash Analysis Center activities • Shoulder Rumble Strips • Interactive Highway Safety Design Model (IHSDM) – Add Modules & Training • Retroreflectivity / UV Demonstration • Older Driver Workshops FHWA Office of Safety
Intersection; Speeding;Pedestrian & Bicyclist Crashes Safety Features for Pedestrians and Bicyclists Variable Speed Limits Intersection Design & Enforcement FHWA Office of Safety
Intersections • Stop Red Light Running (RLR) Campaign • Automated Enforcement for RLR • Surrogate Safety Measures for Intersections • Use of Innovative Technologies (esp. coord. with ITS / IVI efforts) • Roundabout Guide / Workshops / Analysis Tools • National Agenda-Setting Workshop • Lead by AASHTO / FHWA; w/ ITE, other partners • November 2001 FHWA Office of Safety
Speed - Related • Speed Setting Demonstrations • Workshops • Speed Exhibit • Variable Speed Limit Operational Test • Perceptual Measures for Controlling Speed (Based on Human Factors) FHWA Office of Safety
Pedestrians & Bicyclists • Pedestrian Safety Countermeasure Selection System • University Pedestrian and Bicyclist Course • Pedestrian and Bicyclist Resource Set (on CD) • Pedestrian “Safer Journey” CD • Pedestrian Safety Engineering Outreach and Awareness Campaign • Pedestrian Safety Engineering and ITS-based Countermeasures FHWA Office of Safety
Program-Wide Initiatives • Expanding Partnerships – Internal & External • Advance AASHTO Strategic Safety Plan • Integration of Safety w/ Planning Process • Highway Safety Improvement Program (HSIP): Coordinated Best Practices Review w/ FHWA Field & States – Quality of Safety Data a Key Issue • 2001 National Highway Safety Awards • Emphasizing Role of Technology & Innovation FHWA Office of Safety
AASHTO Strategic Highway Safety Plan Leadership by AASHTO with the assistance of • Federal Highway Administration • National Highway Traffic Safety Administration • TRB Committee on Transportation Safety Management • ITE • National safety experts in driver, vehicle, and highway issues . FHWA Office of Safety
Key Issues • Fatality and Injury Numbers on a “Plateau”:What new opportunities are out there to restore progress? • Data:Quality, Timeliness & Value to Countermeasure Development & Safety Conscious Planning • Needs of Localities:Significant Part of Problem Is on Local Roads • Growing Older Driver Population:Safety impacts, particularly at complex intersections and interchanges • Intersection Safety:Growing concern as high-crash location; aggressive driving, traffic control & enforcement issues FHWA Office of Safety
Highway Safety Public Awareness · Moving Safely Across America - interactive highway safety experience CD-ROM and Kiosk · Read Your Road - Every Highway User’s Guide to Driving Safely · Stop Red Light Running video · Night Lights video - explains how retroreflectivity saves lives · Safer Journey Interactive Pedestrian Safety Awareness – the “Gold Camera” award winning CD-ROM · Walkable Community brochure · Everyone is a Pedestrian brochure set · Red Light-Green Light video on intersection safety · National Work Zone Awareness Week educates the public about safe driving in work zones · Put the Brakes on Fatalities Day - a new highway safety outreach campaign observed October 10th each year. FHWA Office of Safety