Download
1 / 19

E N D
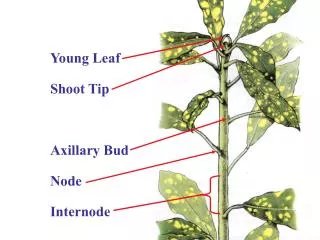
Stem & Leaf Plots A stem – and – leaf plot is another method for organizing data. Each number in the data is broken up into a “stem” and a “leaf”. The “leaf” IS ALWAYS the last digit in the number ( the ones place ). The “stem” IS ALWAYS the numbers preceding the last digit ( no matter how many are there ).
Stem & Leaf Plots A stem – and – leaf plot is another method for organizing data. Each number in the data is broken up into a “stem” and a “leaf”. The “leaf” IS ALWAYS the last digit in the number ( the ones place ). The “stem” IS ALWAYS the numbers preceding the last digit ( no matter how many are there ). EXAMPLE # 1 : This stem and leaf plot shows the test scores ranging from 60 to 100. 6 0 5 7 7 5 8 0 5 5 8 9 9 0 2 4 5 5 7 10 0 0 0
Stem & Leaf Plots A stem – and – leaf plot is another method for organizing data. Each number in the data is broken up into a “stem” and a “leaf”. The “leaf” IS ALWAYS the last digit in the number ( the ones place ). The “stem” IS ALWAYS the numbers preceding the last digit ( no matter how many are there ). EXAMPLE # 1 : This stem and leaf plot shows the test scores ranging from 60 to 100. 6 0 5 7 To create the data list, just put each “leaf” behind the “stem” to the left of the vertical line… 7 5 8 0 5 5 8 9 9 0 2 4 5 5 7 10 0 0 0
Stem & Leaf Plots A stem – and – leaf plot is another method for organizing data. Each number in the data is broken up into a “stem” and a “leaf”. The “leaf” IS ALWAYS the last digit in the number ( the ones place ). The “stem” IS ALWAYS the numbers preceding the last digit ( no matter how many are there ). EXAMPLE # 1 : This stem and leaf plot shows the test scores ranging from 60 to 100. 6 0 5 7 60 To create the data list, just put each “leaf” behind the “stem” to the left of the vertical line… 7 5 8 0 5 5 8 9 9 0 2 4 5 5 7 10 0 0 0
Stem & Leaf Plots A stem – and – leaf plot is another method for organizing data. Each number in the data is broken up into a “stem” and a “leaf”. The “leaf” IS ALWAYS the last digit in the number ( the ones place ). The “stem” IS ALWAYS the numbers preceding the last digit ( no matter how many are there ). EXAMPLE # 1 : This stem and leaf plot shows the test scores ranging from 60 to 100. 6 0 5 7 60 , 65 To create the data list, just put each “leaf” behind the “stem” to the left of the vertical line… 7 5 8 0 5 5 8 9 9 0 2 4 5 5 7 10 0 0 0
Stem & Leaf Plots A stem – and – leaf plot is another method for organizing data. Each number in the data is broken up into a “stem” and a “leaf”. The “leaf” IS ALWAYS the last digit in the number ( the ones place ). The “stem” IS ALWAYS the numbers preceding the last digit ( no matter how many are there ). EXAMPLE # 1 : This stem and leaf plot shows the test scores ranging from 60 to 100. 6 0 5 7 60 , 65 , 67 To create the data list, just put each “leaf” behind the number to the left of the vertical line… 7 5 8 0 5 5 8 9 9 0 2 4 5 5 7 10 0 0 0
Stem & Leaf Plots A stem – and – leaf plot is another method for organizing data. Each number in the data is broken up into a “stem” and a “leaf”. The “leaf” IS ALWAYS the last digit in the number ( the ones place ). The “stem” IS ALWAYS the numbers preceding the last digit ( no matter how many are there ). EXAMPLE # 1 : This stem and leaf plot shows the test scores ranging from 60 to 100. 6 0 5 7 60 , 65 , 67 7 5 75 8 0 5 5 8 9 9 0 2 4 5 5 7 10 0 0 0
Stem & Leaf Plots A stem – and – leaf plot is another method for organizing data. Each number in the data is broken up into a “stem” and a “leaf”. The “leaf” IS ALWAYS the last digit in the number ( the ones place ). The “stem” IS ALWAYS the numbers preceding the last digit ( no matter how many are there ). EXAMPLE # 1 : This stem and leaf plot shows the test scores ranging from 60 to 100. 6 0 5 7 60 , 65 , 67 7 5 75 8 0 5 5 8 9 80 , 85 , 85 , 88 , 89 9 0 2 4 5 5 7 10 0 0 0
Stem & Leaf Plots A stem – and – leaf plot is another method for organizing data. Each number in the data is broken up into a “stem” and a “leaf”. The “leaf” IS ALWAYS the last digit in the number ( the ones place ). The “stem” IS ALWAYS the numbers preceding the last digit ( no matter how many are there ). EXAMPLE # 1 : This stem and leaf plot shows the test scores ranging from 60 to 100. 6 0 5 7 60 , 65 , 67 7 5 75 8 0 5 5 8 9 80 , 85 , 85 , 88 , 89 9 0 2 4 5 5 7 90 , 92 , 94 , 95 , 95 , 97 10 0 0 0
Stem & Leaf Plots A stem – and – leaf plot is another method for organizing data. Each number in the data is broken up into a “stem” and a “leaf”. The “leaf” IS ALWAYS the last digit in the number ( the ones place ). The “stem” IS ALWAYS the numbers preceding the last digit ( no matter how many are there ). EXAMPLE # 1 : This stem and leaf plot shows the test scores ranging from 60 to 100. 6 0 5 7 60 , 65 , 67 7 5 75 8 0 5 5 8 9 80 , 85 , 85 , 88 , 89 9 0 2 4 5 5 7 90 , 92 , 94 , 95 , 95 , 97 10 0 0 0 100 , 100 , 100
Stem & Leaf Plots To create a stem and leaf plot from a list of data, we first must get the data in ascending order ( small to big ).
Stem & Leaf Plots To create a stem and leaf plot from a list of data, we first must get the data in ascending order ( small to big ). EXAMPLE # 2 : Create a stem – and – leaf plot from the following test scores. 77 , 83 , 71 , 66 , 97 , 77 , 86 , 62 , 75 , 93 , 87
Stem & Leaf Plots To create a stem and leaf plot from a list of data, we first must get the data in ascending order ( small to big ). EXAMPLE # 2 : Create a stem – and – leaf plot from the following test scores. 77 , 83 , 71 , 66 , 97 , 77 , 86 , 62 , 75 , 93 , 87 Get your data in ascending order … 62 , 66 , 71 , 75 , 77 , 77 , 83 , 86 , 87 , 93 , 97
Stem & Leaf Plots To create a stem and leaf plot from a list of data, we first must get the data in ascending order ( small to big ). Now identify all the “stems”. All numbers that appear IN FRONT of the last digit. EXAMPLE # 2 : Create a stem – and – leaf plot from the following test scores. 77 , 83 , 71 , 66 , 97 , 77 , 86 , 62 , 75 , 93 , 87 62 , 66 , 71 , 75 , 77 , 77 , 83 , 86 , 87 , 93 , 97 Identify your “stems “
Stem & Leaf Plots To create a stem and leaf plot from a list of data, we first must get the data in ascending order ( small to big ). Now identify all the “stems”. All numbers that appear IN FRONT of the last digit. EXAMPLE # 2 : Create a stem – and – leaf plot from the following test scores. 62 , 66 , 71 , 75 , 77 , 77 , 83 , 86 , 87 , 93 , 97 List them on the left side of the vertical line ( no need to repeat any… ) 6 7 8 9
Stem & Leaf Plots Now identify all your “leafs”. Again, it is the last digit… EXAMPLE # 2 : Create a stem – and – leaf plot from the following test scores. 62 , 66 , 71 , 75 , 77 , 77 , 83 , 86 , 87 , 93 , 97 6 7 8 9
Stem & Leaf Plots Now identify all your “leafs”. Again, it is the last digit… EXAMPLE # 2 : Create a stem – and – leaf plot from the following test scores. 62 , 66 , 71 , 75 , 77 , 77 , 83 , 86 , 87 , 93 , 97 6 7 8 9
Stem & Leaf Plots Now identify all your “leafs”. Again, it is the last digit… EXAMPLE # 2 : Create a stem – and – leaf plot from the following test scores. 62 , 66 , 71 , 75 , 77 , 77 , 83 , 86 , 87 , 93 , 97 List them next to their stem…and you must repeat if multiple leafs occur… 6 2 6 7 1 5 7 7 3 6 7 8 3 7 9