Download
1 / 27
270 likes | 399 Views
Δ G/G Extraction From High-P t Hadron Pairs at COMPASS. Ahmed El Alaoui Nuclear Physics School, Erice, 16-24 September 2007 On Behalf Of COMPASS Collaboration. Outline. Introduction COMPASS Experimental Setup Data Analysis Results Summary and Conclusion. Naive Quark Model

E N D
ΔG/G Extraction From High-Pt Hadron Pairs at COMPASS Ahmed El Alaoui Nuclear Physics School, Erice, 16-24 September 2007 On Behalf Of COMPASS Collaboration
Outline • Introduction • COMPASS Experimental Setup • Data Analysis • Results • Summary and Conclusion
Naive Quark Model Pure valence description of constituent quarks: ∆u = + 4/3 ∆d = - 1/3 ∆Σ = 1 SPIN CRISIS A measurement of ∆G is needed Nucleon Spin Relativistic Quark Model∆Σ ≈ 0.75 QCD framework Hyperons β decay constants + SU(3) flavor symmetry ∆Σ = a0 ≈ 0.60 compatible with the Relativistic QM prediction However,theEMC measured ∆Σ = 0.12 ± 0.09 ± 0.14 a0 = ΔΣ – (3αs/2π)ΔG - To access the gluon contribution to the nucleon spin - To understand the role of the Axial Anomaly in the explanation of the spin crisis
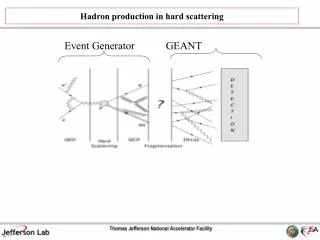
How To Acess ΔG/G Indirect Measurement: QCD analysis: fit to the nucleon spin structure function g1(x) Unfortunately, the limited range in Q2 does not allow for a precise determination of ∆G Direct Measurement: ∆G/G can be accessed via Photon Gluon Fusion (PGF) process
PGF APGF = aLL x(∆G/G) factorization theorem PGF Process • Two approaches are used to tag PGF process • q = c: • - Open Charm D0, D* decay • Clean signal • Combinatorial background • - Low statistics • q = u, d, s: • - High-pt hadron Pairs • Physical background • High statistics
How To Acess ΔG/G Indirect Measurement: QCD analysis: fit to the nucleon spin structure function g1(x) Unfortunately, the limited range in Q2 does not allow a for precise determination of ∆G Direct Measurement: ∆G/G can be accessed via Photon Gluon Fusion (PGF) process Three independent measurements were done at COMPASS - Open Charm - High pt hadron pairs production at Q2>1GeV2 - High pt hadron pairs production at Q2<1GeV2
COMPASS Collaboration COMPASS COmmon Muon and Proton Apparatus for Structure and Spectroscopy 250 Physicists 18 Institutes 12 Countries
LHC SPS luminosity: ~5 1032 cm-2 s-1 beam intensity: 2.108 µ+/spill (4.8s/16.2s) beam momentum: 160 GeV/c Experiment Layout
Muon Wall 1 SM2 Muon Wall 2 E/HCAL2 E/HCAL1 RICH SM1 DC MicroMegas SAS 50 m long Polarized Target LAS 160 GeV μ beam Polarization ~ 80% COMPASS Spectrometer Tracking: SciFi, Silicon, MicroMegas, GEMs, MWPC, Straws PID: RICH, Calorimeters, μFilters
-100 -50 0 50 [cm] COMPASS Target Two 60 cm long oppositely polarized cells 6LiD is used as a material dilution factor ~ 0.4 Target Polarization ~ 50% 70 mrad acceptance (180 mrad for 2006 target) Vertex distribution
2 ΣPt > 2.5 GeV2 High Pt Events Selection • Primary vertex with at least μ, μ’ and 2 hadrons 0.35 < y < 0.9 (Q2<1GeV2) 0.1 < y < 0.9 (Q2>1GeV2) Pt > 0.7 GeV 0.0 < z, xF < 1.0 0.0 < z1+z2 < 0.95 ECalo/P > 0.3 minv(h1,h2) > 1.5 GeV
B μ Aexp = (Nu - Nd)/(Nu + Nd) The acceptance is not identical in both cells Asymmetry bias High Pt Spin Asymmetry
B B μ μ ‘ ‘ ‘ ‘ ‘ Aexp = (Nu - Nd)/(Nu+ Nd) ‘ A||/D=(Aexp- Aexp)/2fPTPBD High Pt Spin Asymmetry Aexp = (Nu - Nd)/(Nu+ Nd) Polarisation reversal each 8 hours f Dilution factor PT(B) Target(Beam) polarization D Depolarization factor To improve the statistical error, a weighted method is used in the asymmetry calculation: w = fDPB (event-wise weight)
A||/D = RPGF∆G/G aLL PGF QCDC + RQCDC∆q/qaLL γ qq γ + Rqq∆q/qaLL (∆q/q) + Rqg∆G/GaLL (∆q/q) qg γ gq + Rgq∆q/qaLL (∆G/G) γ gg + Rgg∆G/G aLL (∆G/G) qq’ qq’ ∆G/G at Q2<1GeV2 Resolved photon processes γ γ Ri(fraction of the process i), aLL, ∆q, q, q and G are obtained from - Monte Carlo Simulation based on PYTHIA generator and Geant. - pQCD Calculation - pdf in the nucleon from GRSV2000 and GRV98LO parametrization - pdf in the photon from GRS parametrization γ γ The polarized pdfs in the photon ∆q and ∆G are not available. Therefore the positivity limit is used to constrain them which leads to 2 extreme scenarios. Included as systematic error in the estimation of ∆G/G
Process fractions (Q2<1GeV2) Resolved photons processes 32% 12% 50%
μ2 = 3GeV2 +0.070 xg = 0.085-0.035 ∆G/G Result at Q2<1GeV2 2002-2004 data A||/D = 0.004 ± 0.013(stat.) ± 0.003(syst.) ∆G/G(xg,μ2) = 0.016 ± 0.058(stat.) ± 0.055(syst.) Contribution to Syst. error comes from - False asymmetry - Monte Carlo tuning - Resolved photon process
QCDC PGF LO A||/D = RPGF∆G/G aLL + RQCDC ∆Q/Q aLL QCDC PGF + RLO ∆Q/Q aLL LO ∆G/G at Q2>1GeV2 Contribution from resolved photon precesses is negligible in this case At Q2>1GeV2 analysis, Lepto generator seems to describe the real data much better than PYTHIA. It was then used to estimate the fraction of each process
2004 Data Analysis is in progress… ∆G/G Result at Q2>1GeV2 • 2002 - 2003 Data A||/D = -0.015 ± 0.080(stat.) ± 0.013(syst.) ∆G/G(xg, μ2) = 0.06 ± 0.31(stat.) ± 0.06(syst.) μ2 = 3GeV2 <xg> = 0.13 Contribution to Syst. error comes from - False asymmetry - Monte Carlo tuning
The most precise measurement up to now Double the statistics obtained in 2004 Access higher value of xg Summary and Conclusion - High-Pt asymmetries at Q2>1GeV2 and Q2<1GeV2were presented - The new solenoid, installed in 2006, has an acceptance (180 mrad) three times larger than the previous one. - The measured ∆G/G is compatible with zero at xg = 0.1 • Analysis of 2004 data (at Q2>1GeV2) is almost finished. It will be • released soon Thank you
∆G ≡ ∫ ∆G(xg) dxg ≈ 0.2 - 0.3 Fit to g1(x) using DGLAP evolution equations provides 2 differents solutions : ∆G >0 and ∆G <0. Both solutions describe the data well. The first moment of ∆Gobtained from the fit is