Download
1 / 61
620 likes | 791 Views
Return. Risk. Chapter 6 - Risk and Rates of Return. Tujuan Pembelajaran. Mahasiswa mampu untuk : Menjelaskan hubungan antara tingkat imbal hasil yang diharapkan dengan risiko Menjelaskan efek inflasi atas tingkat imbal hasil Menjelaskan term structure dari tingkat bunga

E N D
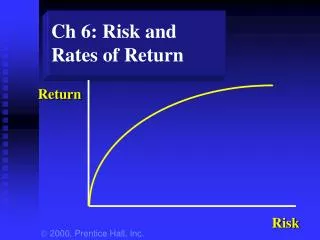
Return Risk Chapter 6 - Risk and Rates of Return
TujuanPembelajaran • Mahasiswamampuuntuk: • Menjelaskanhubunganantaratingkatimbalhasil yang diharapkandenganrisiko • Menjelaskanefekinflasi atas tingkatimbalhasil • Menjelaskantermstructuredaritingkat bunga • Mendefinisikan dan mengukurtingkatimbalhasil yang diharapkan dan risikodarisuatusuatuinvestasi • Menjelaskanpengaruhdiversifikasiterhadapimbalhasil yang diharapakan dan tingkatrisikodarisuatuportofolioataukombinasiaset • Mengukurrisiko pasar darisuatuaset dan portofolioinvestasi • Menjelaskanhubungan antara tingkatimbalhasil yang dimintainvestor dan tingkatrisikodarisuatuinvestasi
PokokBahasan • Tingkat imbalhasildiPasarKeuangan • Efekinflasiterhadaptingkatimbalhasil dan Efek Fisher • TermStrucuturedaritingkat bunga • Tingkatimbalhasil yang diharapkan • Risiko • Risiko dan diversifikasi • Mengukurrisiko pasar • Mengukur beta darisuatuportofolio • Ttingkatimbalhasil yang dimintainvestor
Interest Rates Inflation, Rates of Return, and the Fisher Effect
Conceptually: Real risk-free Interest Rate k* Nominal risk-free Interest Rate krf Inflation- risk premium IRP = + Mathematically: (1 + krf) = (1 + k*) (1 + IRP) This is known as the “Fisher Effect” Interest Rates
Interest Rates • Suppose the real rate is 3%, and the nominal rate is 8%. What is the inflation rate premium? (1 + krf) = (1 + k*) (1 + IRP) (1.08) = (1.03) (1 + IRP) (1 + IRP) = (1.0485), so IRP = 4.85%
yield to maturity time to maturity (years) Term Structure of Interest Rates • The pattern of rates of return for debt securities that differ only in the length of time to maturity.
yield to maturity time to maturity (years) Term Structure of Interest Rates • The yield curve may be downward sloping or “inverted” if rates are expected to fall.
yield to maturity time to maturity (years) Term Structure of Interest Rates • The yield curve may be downward sloping or “inverted” if rates are expected to fall.
Required rate of return Risk-free rate of return = For a Treasury security, what is the required rate of return? Since Treasuries are essentially free of default risk, the rate of return on a Treasury security is considered the “risk-free” rate of return.
Required rate of return Risk-free rate of return Risk premium = + For a corporate stock or bond, what is the required rate of return? How large of a risk premium should we require to buy a corporate security?
Returns • Expected Return - the return that an investor expects to earn on an asset, given its price, growth potential, etc. • Required Return - the return that an investor requires on an asset given itsriskand market interest rates.
Expected Return State of Probability Return Economy (P) Orl. Utility Orl. Tech Recession .20 4% -10% Normal .50 10% 14% Boom .30 14% 30% For each firm, the expected return on the stock is just a weighted average: k = P(k1)*k1 + P(k2)*k2 + ...+ P(kn)*kn
Expected Return State of Probability Return Economy (P) Orl. Utility Orl. Tech Recession .20 4% -10% Normal .50 10% 14% Boom .30 14% 30% k = P(k1)*k1 + P(k2)*k2 + ...+ P(kn)*kn k (OU) = .2 (4%) + .5 (10%) + .3 (14%) = 10%
Expected Return State of Probability Return Economy (P) Orl. Utility Orl. Tech Recession .20 4% -10% Normal .50 10% 14% Boom .30 14% 30% k = P(k1)*k1 + P(k2)*k2 + ...+ P(kn)*kn k (OI) = .2 (-10%)+ .5 (14%) + .3 (30%) = 14%
Based only on your expected return calculations, which stock would you prefer?
Have you considered RISK?
What is Risk? • The possibility that an actual return will differ from our expected return. • Uncertainty in the distribution of possible outcomes.
Company A Company B return return What is Risk? • Uncertainty in the distribution of possible outcomes.
How do We Measure Risk? • To get a general idea of a stock’s price variability, we could look at the stock’s price range over the past year. 52 weeks Yld Vol Net Hi Lo Sym Div % PE 100s Hi Lo Close Chg 134 80 IBM .52 .5 21 143402 98 95 9549 -3 115 40 MSFT … 29 558918 55 52 5194 -475
How do We Measure Risk? • A more scientific approach is to examine the stock’s standard deviation of returns. • Standard deviation is a measure of the dispersion of possible outcomes. • The greater the standard deviation, the greater the uncertainty, and, therefore, the greater the risk.
s n i=1 S Standard Deviation = (ki - k)2 P(ki)
s = (ki - k)2 P(ki) n i=1 S Orlando Utility, Inc. ( 4% - 10%)2 (.2) = 7.2 (10% - 10%)2 (.5) = 0 (14% - 10%)2 (.3) = 4.8 Variance = 12 Stand. dev. = 12 = 3.46%
s = (ki - k)2 P(ki) n i=1 S Orlando Technology, Inc. (-10% - 14%)2 (.2) = 115.2 (14% - 14%)2 (.5) = 0 (30% - 14%)2 (.3) = 76.8 Variance = 192 Stand. dev. = 192 = 13.86%
Which stock would you prefer? How would you decide?
Summary Orlando Orlando Utility Technology Expected Return10% 14% Standard Deviation3.46% 13.86%
Return Risk It depends on your tolerance for risk! Remember, there’s a tradeoff between risk and return.
Portfolios • Combining several securities in a portfolio can actually reduce overall risk. • How does this work?
rate of return time Suppose we have stock A and stock B. The returns on these stocks do not tend to move together over time (they are not perfectly correlated).
kA rate of return kB time Suppose we have stock A and stock B. The returns on these stocks do not tend to move together over time (they are not perfectly correlated).
What has happened to the variability of returns for the portfolio? kA kp rate of return kB time
Diversification • Investing in more than one security to reduce risk. • If two stocks are perfectly positively correlated, diversification has no effect on risk. • If two stocks are perfectly negatively correlated, the portfolio is perfectly diversified.
If you owned a share of every stock traded on the NYSE and NASDAQ, would you be diversified? YES! • Would you have eliminated all of your risk? NO! Common stock portfolios still have risk.
Some risk can be diversified away and some cannot. • Market risk (systematic risk) is nondiversifiable. This type of risk cannot be diversified away. • Company-unique risk(unsystematic risk) is diversifiable. This type of risk can be reduced through diversification.
Market Risk • Unexpected changes in interest rates. • Unexpected changes in cash flows due to tax rate changes, foreign competition, and the overall business cycle.
Company-unique Risk • A company’s labor force goes on strike. • A company’s top management dies in a plane crash. • A huge oil tank bursts and floods a company’s production area.
portfolio risk company- unique risk Market risk number of stocks As you add stocks to your portfolio, company-unique risk is reduced.
Do some firms have more market risk than others? Yes. For example: Interest rate changes affect all firms, but which would be more affected: a) Retail food chain b) Commercial bank
Note As we know, the market compensates investors for accepting risk - but only for market risk. Company-unique risk can and should be diversified away. So - we need to be able to measure market risk.
This is why we have Beta. Beta: a measure of market risk. • Specifically, beta is a measure of how an individual stock’s returns vary with market returns. • It’s a measure of the “sensitivity” of an individual stock’s returns to changes in the market.
The market’s beta is 1 • A firm that has a beta = 1 has average market risk. The stock is no more or less volatile than the market. • A firm with a beta > 1 is more volatile than the market. • (ex: technology firms) • A firm with a beta < 1 is less volatile than the market. • (ex: utilities)
Beta = slope = 1.20 XYZ Co. returns . . . 15 . . . . . . . . 10 . . . . . . . . 5 . . . . S&P 500 returns . . . . -15 -10 5 15 -5 10 -5 . . . . . . . . -10 . . . . . . . . -15 Calculating Beta
Summary: • We know how tomeasure risk, using standard deviation for overall risk and beta for market risk. • We know how to reduce overall risk to only market risk through diversification. • We need to know how to price risk so we will know how much extra return we should require for accepting extra risk.
What is the Required Rate of Return? • The return on an investment required by an investor given market interest rates and the investment’s risk.
Required rate of return Risk-free rate of return Risk premium = + market risk company- unique risk can be diversified away
Let’s try to graph this relationship! Required rate of return Beta
security market line (SML) 12% Risk-free rate of return (6%) Beta 1 Required rate of return .
This linear relationship between risk and required return is known as the Capital Asset Pricing Model (CAPM).
SML Is there a riskless (zero beta) security? 12% Treasury securities are as close to riskless as possible. Risk-free rate of return (6%) 0 1 Required rate of return . Beta