Download
1 / 26
260 likes | 407 Views
R esults from the Telescope Array experiment. H. Tokuno Tokyo Tech The Telescope Array Collaboration. The Telescope Array Collaboration. ~140 Collaborators 26 Institutions 5 countries. FD. Extensive Air Shower Detectors. Ultra High Energy Cosmic Ray .

E N D
Results from the Telescope Array experiment H. Tokuno Tokyo Tech The Telescope Array Collaboration
The Telescope Array Collaboration ~140 Collaborators 26 Institutions 5 countries
FD Extensive Air Shower Detectors Ultra High Energy Cosmic Ray Air Fluorescence detectors (FDs) EAS longitudinal development Calorimetric Energy determination ~10% duty cycle (moonless clear night) FD Surface Detectors (SDs) EAS lateral distribution Energy estimation from MC simulation ~100% duty cycle The two different detectors have different advantages
TA Detectors Utah, USA 507 x Surface Detector ~700km2 FD ~30km 3 x FD stations FD FD T. Abu-Zayyad, et al., NIM A (2012), http://dx.doi.org/ 10.1016/j.nima.2012.05.079 H. Tokuno et al. / NIM A 676 (2012) 54–65
Surface Detectors (SDs) SD 2 layered plastic scintillators Timing differences - Arrival direction Lateral distribution of EAS - Primary Energy 3m2 t=1.2cm Timing fit arrival direction Lateral distribution fit primary energy Radius: # of particle Color: arrival timing
Air Fluorescence Detectors (FDs) Moved from HiRes Middle Drum 14 cameras/station 256 PMTs/camera 5.2 m2 ~30km New FDs 12 cameras/station 256 PMTs/camera Long Ridge Black Rock Mesa 6.8 m2 ~1 m2
Energy Scale difference ESD: Rescaled by EFD ESD = ESD(MC-base) / 1.27 EFD FD Energy uncertainties log(EFD/eV) Combined resolution ~ 30% ESD log(Rescaled ESD/eV) Submitted to PRL arXiv:1205.5067
Energy Spectrum from SD Cut off structure@1019.68eV (48EeV) 1018eV=1EeV 3 years Observed data 10997 events > 1019.68eV Number of expected events from a linear extrapolation : 54.9 Number of observed events: 28 Poisson probability = 4.75 x10⁻⁵ 3.9 sigma significance from a linear extrapolation May 11, 2008 -- April 25, 2011. Energy>1018.2eV arXiv:1205.5067
Primary Particle type Information from FD data
Longitudinal development of EAS FDs Longitudinal development Maximum development point (Xmax) depends on particle type Xmax of Proton EASs -- Deeper -- larger fluctuations Proton 1018eV Iron 1018eV Number of EAS particles Atmospheric Depth (g/cm2)
Xmax distributions # of events: 30 65 68 49 33 23 8 3 Proton 1018.3eV Iron Preliminary KS-test 1018.5eV • Consistent with Proton MC • 1018.2 – 1019.4eV • need more statistics • in other energy ranges 1018.7eV • MC: QGSJET-II, FD: Stereo
AGN correlation Galactic plane 11/25 TA FOV boundary TA FOV boundary Galactic coordinate CR threshold Energy >57EeV Observed CR (AGN found < 3.1o) Observed CR (AGN not found < 3.1o) AGN ( VCV catalog, distance < 75Mpc) No significant correlation Consistent with isotropic (Auto correlation also) The 2ndhighest event (1020.14eV) falls near an Auger event (1020.09eV) within 1.5o arXiv:1205.5984 2008Mar11—2011Sep15 (40 Months)
Large scale correlation Open circle: Observed CR (Energy > 57EeV) Contours: Expected flux from Large scale structure includes SD exposure Galactic plane Flux calculation: Particle type: proton Matter distribution Distance <250Mpc: 2MASS extended D >250Mpc: isotropic Smearing angle 6o SD exposure Galactic coordinate Larger scale structure correlation and isotropic hypothesis both are consistent with our observed data arXiv:1205.5984 2008Mar11—2011Sep15 (40 Months)
Summary • FD/SD Observation is running ~4 years (from 2008) • Energy scale difference between FD and SD: 1.27 • SD energy is rescaled • FD End to End calibration with an electron light source • 40MeV, 109 electron, 100m far from FD • Energy Spectrum (arXiv:1205.5067) • Cutoff structure @1019.68eV • 3.9 sigma difference from non-cutoff hypothesis • Composition (preliminary results) • Proton dominant @ 1018.2—1019.4eV • need more statistics in other energy ranges • systematic uncertainties are studying now. • Arrival directions (arXiv:1205.5984) • Consistent with an isotropic model • No significant correlation (AGNs, Auto-correlation, Large scale structure)
SD Analysis:Energy Determination • Energy determination table is constructed from the fitting results of the Monte Carlo. • First estimation of the event energy is done by interpolating between S800 vs. secθ isoclines. log S800 secq
SD Energy Spectrum:Broken Power Law Fit 3 years data, 10,997 events
Xmax Biased model prediction Biased model prediction: includes detection biases Event cut criteria: relaxed cut
Small scale correlation # of Observed /# of Expected Auto correlation of arrival directions of observed CR 988events E>10EeV Normalized expected Number from isotropic Opening Angles 57events E>40EeV Observed CR Energy > threshold 2008Mar11—2011Sep15 No significant correlation Consistent with isotropic 25events E>57EeV Submitted to ApJ arXiv:1205.5984
Electron Light Source FD End to End Calibration 40MeV, 109 electrons, 1Hz, 100 m from FD preliminary Longitudinal development Lateral distribution Observed Data Simulation preliminary Observed Event DATA
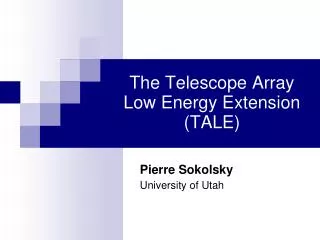
TA Low energy Extension (TALE) TALE 16.5 19 Target Energy range: Transition galactic and Extra-galactic CR 26 log10(E2xF[eV2m-2s-1sr-1]) 25 13 14 15 16 17 18 19 20 21 2nd knee TA ankle log10(E/eV) 24 23
TA+TALE (under construction) (FD@MD) TA MD FD TALE SD TALE MD FD TA SD シンチレータ地表検出器 (SD) (Scintillator) Energy Calibration FDcalibrated by ELS @TA cross-calibration TA vs. TALE FD vs. SD TA LR FD TA BR FD