Download
1 / 34
340 likes | 458 Views
Vicki Worden GBI Commercial Programs vworden@thegbi.org 202-841-2999. GBI Solutions. Objectives. GBI view of the problem Green Globes™ for Continual Improvement – U.S. Pilot Program GBI Solutions for Cities. The Problem: Adoption, Actual Performance. Why Are We Here?.

E N D
Vicki WordenGBI Commercial Programsvworden@thegbi.org202-841-2999
Objectives • GBI view of the problem • Green Globes™ for Continual Improvement – U.S. Pilot Program • GBI Solutions for Cities
Energy Trends and Predictions /3 DOE/EIA CBECS Trend with 95% CI (June 2006) 125 (36.6) 125 * No significant change in surveyed energy consumption for the last 25 years 100 (29.3) * * * * * * * Insignificant change in energy targets for the last 30 years Ave = 88 KBtu/sf-yr ∆ = 43% EO 13123 (PBS P100) 75 (22.0) Energy Consumption, KBtu/sf-yr AIA BEPS (1976) X Y Y Y 50 (14.7) 50 Typical GSA Target Z DOE Goals (2006) ASHRAE Std 90.1-1989 ASHRAE Std 90.1-1999 ASHRAE Std 90.1-2004 ASHRAE Std 90A-1980 25 (7.3) 25 ASHRAE Std 90-75 To 16K by 2025 75 80 85 90 95 00 05 10 15 20 Year Source: James E. Woods, Ph.D., P.E The Building Diagnostics Research Institute, Inc. Data in brackets ekWh/sf-yr
GSA Portfolio Energy Use From: NIBS, 2003
Problem—Conclusions • Buildings in operation are major contributors to carbon emissions • Relying on predictions of energy performance and code is not enough for new buildings • Improving the existing building stock is an imperative to meeting 2030 Challenge
GBI Suggestions for Cities • Set goals for existing building stock • Emphasize benchmarking using actual building performance data---such as the EPA’s Target of 75 or greater • Take Green Globes for Continual Improvement for a test drive… Join the U.S. Pilot of Green Globes for Continual Improvement of Existing Buildings. www.thegbi.org
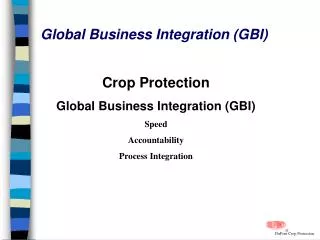
Our Approach Residential Commercial
Reuse Occupancy PreDesign Construction Design Green Globes System: A Building Life Cycle Approach • Web-based questionnaire’s prompt next steps throughout the nine stages of planning • Project Initiation • Site Analysis • Programming • Schematic Design • Design Development • Constructions Documents • Contracting and Construction • Commissioning • Measured Performance: Continual Improvement of Existing Buildings System generates early assessments to guide improvements in design and operations The Project Loop Verified Rating: Must have third-party verification to be a Green Globes building. This can occur after construction for new buildings or after 1-2 years of operations for existing structures.
Common Benchmark- EPA Target Finder Operation Design
Present Calculation 0 Pts 100 Pts Energy Star 75% Target Carbon Neutral – 2030 Challenge 50% Reduction – 2010 Challenge US Building Average 0 5 (17) 10 (34) 15 (51) 20 (68) 25 (85) 30 (102) Annual Energy Consumption kWh/SF-year (kBtu/SF-year)
Green Globes Offerings • Green Globes for Design/New Construction guides the Integrated Design Process at each stage of project delivery. • U.S. Pilot • Completed 2006 • Green Globes for Continual Improvement establishes the baseline, gives a current performance report, guides improvement. • Sign up for U.S. Pilottoday!
Enter Building Performance Data Tip box Explains verification requirements. Questionnaire Questions are “yes”, “no” or “n/a”, multiple choice, require data entry or description.
Report Screen Chart shows percentage of points achieved for each section in meeting the best green design practice .
View the Report Achievements
View the Report Recommendations for improvement
View the Report Supplementary information Hyperlinked web references
Region 2 Portfolio Approach Case Study The benchmarking can help identify the opportunities and track improvements.
Government Recognition • “I would like to commend the • efforts of the Central NM • HBA and the GBI for making • Build Green New Mexico • a reality.” • Martin Chavez • Mayor, City of Albuquerque
GBI 2005-2006 Track Record • 16 residential programs up and running • NAHB guidelines released in 10 climate sensitive versions, interactive version in the works • 1000 trained on Green Globes system • U.S. pilot of Green Globes for Design/New Construction concludes—8 buildings certified, 150+ using the system • U.S. pilot of Green Globes for Continual Improvement of Existing Buildings launched
Questions?www.thegbi.orgVicki Worden202-841-2999vworden@thegbi.org