Download
1 / 34
340 likes | 440 Views
Supply & Demand. The basics of the market economy. What is it…. An economic system is like Legos. It’s made up of smaller “building blocks” of individual markets for trading all the different goods & services used in a country The variety of markets is too big to grasp.

E N D
Supply & Demand The basics of the market economy
What is it…. • An economic system is like Legos. • It’s made up of smaller “building blocks” of individual markets for trading all the different goods & services used in a country • The variety of markets is too big to grasp
Prices, Buyers, and Sellers • Any market has one or more buyers and one or more sellers. • Buyer pays money in exchange for a product (good or service). • Sellers receive money in exchange for supplying the product. • The rate at which the buyer and seller exchange money for the good or service is known as the price.
Prices, Buyers, and Sellers • Each individual or business is typically a buyer in some markets and a seller in others. • Example: the typical worker is considered a seller in the labor market. • Workers sell their time on the job for money • Yet they are buyers in most other areas of their lives
Local, National, and Global Markets • Buyers and sellers who are geographically close to each other are part of a local market. • Milk is generally sold in local markets • Read Spotlight: The Milk Market • Dental Services are typically local
Local, National, and Global Markets • A national market lets buyers and sellers conduct transactions across the country. • Stock-trading, house-hunting, buying books, clothes, electronics, and music can all be done online • Global markets allow buyers and sellers to be anywhere in the world. • Crude oil, steel, fish, natural gas, and memory chips
Local, National, and Global Markets • Global markets are often the province of globe-spanning companies called multinationals, which have operations in multiple countries. • Example: McDonald’s • It was almost an overnight transformation for some local markets into vibrant national or global markets. • Example: eBay
The Market Price • The market price is the typical price at which a good or service sells in a market. • In many cases the price for a good or service may be obvious to identify. • Example: Newspapers & magazines • Other times it is not so easy to identify the price of an item.
The Market Price • Sellers are always adjusting their prices to pull in more customers. • Sale prices are intentionally set below the market price to stimulate purchases. • Negotiated prices are determined by individual buyers and sellers on a case-by-case basis. • A volume discount or a lower price may be offered to buyers making a large purchase. • Advance purchase discounts are offered when you buy in advance.
How Price Affects the Quantity Demanded • The quantity demanded by a particular buyer is the amount that a buyer is willing to purchase at a given price. • It’s not enough to know what consumers are buying today. • We also need to know what would happen to demand if the price of a good or service went up or down.
How Price Affects the Quantity Demanded • The link between a buyer’s quantity demanded and the price is called the demand schedule. • Consider that Sam downloads 20 songs at a price of $0.50 per song. If the price is $2.00 per song, he may decide to download only 3 songs. If the price rises to $4.00 per song, he may decide not to download any songs. • Sam’s demand schedule
How Price Affects the Quantity Demanded • In theory you can build a demand schedule for any good or service. • The market demand schedule sums the demand schedules for all individual buyers in a market. • Demand schedules assume that everything about the buying situation stays the same except for the price.
The Law of Demand • A lower price tends to increase the quantity demanded, all other things equal. • The iPhone and the Law of Demand • This law is a general tendency, not an ironclad rule. • Example: when prices of homes in a city are rising rapidly, buyers sometimes feel that they have to jump in quickly before prices go even higher.
Special Case of Zero Price • There actually are some products that come with a zero price – so you can get an additional unit of a good or service at no extra charge. • Many cell phone plans offer unlimited calling to other cell phones on the same network. • Restaurants offer unlimited refills on coffee or soft drinks.
Special Case of Zero Price • So if the price is zero, why don’t you consume an infinite amount? • You generally reach satiation at some point – meaning that eventually the value to you of consuming any more of the good disappears. • Many goods and services require some time to consume.
Special Case of Zero Price • Even at zero price there’s an opportunity cost to consuming more of a good or service if it requires some of your time. • In doing one thing you are giving up the opportunity to do something else.
Our First Graph • Let’s look at the demand schedule for coffee consumption in a week for an individual. • The first column is the price per cup, and the second column is the number of cups demanded during the week.
Sally’s Demand Schedule for Coffee This demand schedule represents how many cups of coffee Sally will want to buy in a week, depending on the price. Price Per Cup (Dollars) $1.00 $2.00 $3.00 $4.00 $5.00 $6.00 • Quantity Demanded • (Cups Per Week) • 18 • 15 • 12 • 9 • 6 • 3
Our First Graph • The demand schedule can also be represented visually on a graph. • Going up the vertical axis of the graph are the different prices of the coffee • Going across the horizontal axis of the graph are the different quantities demanded • To plot the demand schedule on the graph, we start from a price on the vertical axis & move right until we get to the corresponding quantity.
Our First Graph • Insert Figure 2.1
Our First Graph • Once we have plotted all of the points on the graph, we connect the dots – this is the demand curve. • The demand curve shows the link between price and quantity demanded. • The result is known as a downward-sloping demand curve because the curve we plotted from our data starts at the top left side of the graph and slopes downward to the right. • The Law of Demand suggests that most demand curves will slope downward because price increases reduce the quantities demanded.
How Price Affects the Quantity Supplied • In any market, the quantity supplied by a particular seller is the amount of goods and services that the seller is willing to provide at a given price. • As the price changes, the quantity supplied changes as well. • The supply schedule for a good or service reports the quantity supplied at different selling prices.
Supply Schedule for Helen’s Haircutting Salon • Price Per Haircut • (Dollars) • $ 5.00 • $10.00 • $15.00 • $20.00 • $25.00 • $30.00 • $35.00 • Quantity Supplied • (Haircuts Available in a Week) • 40 • 60 • 80 • 100 • 120 • 140 • 160 For any price of a haircut, this table reports how many haircuts are supplied.
How Price Affects Quantity Supplied • The market supply schedule adds up the quantity supplied by all the sellers in a market. • Example: Suppose there are 10 haircutting salons in town, all with the same supply schedule as Helen’s Salon. Then if the haircut is $20, there will be a total of 1,000 haircuts supplied (1000 haircuts x 10 stores).
The Law of Supply • Says that higher prices tend to increase the quantity supplied of a good or service, assuming nothing else changes. • If the price a business can get for its goods and services rises, it has an incentive to increase production.
The Law of Supply • The law of supply operates in global markets as well. • Suppose a department store chain is selling blue shirts imported from China. If the price of that kind of shirt goes up, the department store chain will order more shirts from its supplier in China. The Chinese factory will need a little time to respond because it must hire more workers and train them.
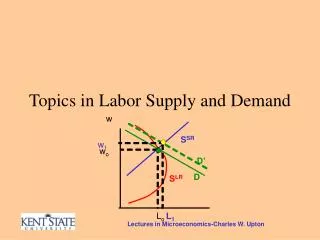
The Law of Supply • A key market where the law of supply generally holds true is the labor market. • The price of labor is the wage rate (what the worker is paid) • A higher wage rate will not have much effect on the labor supplied by people who are already working full-time.
The Law of Supply • However, higher wages do tend to increase the labor supply of people who are less committed to working. • Like the law of demand, the law of supply does not hold true in every circumstance. • In some cases, an increased price can lower supply. • Ex: If you need to work 200 hrs. at $10/hr. to earn $2,000; you will only need to work 100 hrs. if you wage increases to $20/hr.
Graphing the Supply Schedule • Just as we did with the demand schedule, we can plot the supply schedule for a market on a graph. • Going up the vertical axis are the various prices that could be charged. • Going across the horizontal axis is the quantity supplied.
Graphing the Supply Schedule • To plot the supply schedule, we start with the price on the vertical axis and move right horizontally until we come to the number supplied. • Plotting all the combinations on the supply schedule and then connecting the points gives us the supply curve. • The supply curve shows the link between the price & the quantity supplied.
Graphing the Supply Schedule • The result is an upward-sloping supply curve that starts at the lower left corner and goes to the upper right corner of the graph. • Real world supply curves are generally not straight.
Graphing the Supply Schedule • Insert Figure 2.2
New Markets • Demand & supply schedules describe how buyers and sellers behave in existing markets, but the number of markets is not fixed. • New markets are created every day to meet the changing needs of consumers and to take advantage of the changing capability of producers.
New Markets • New markets can provide new products or services, or bring in new buyers and sellers. • Some goods & services we buy today were not available 10, 20, or 30 years ago. • iPods, cell phones, Amazon.com, One Direction throw pillows, PS4, X-Box1, web design, etc. • As income rises in developing countries, new markets open up.