Download
1 / 4
40 likes | 50 Views
Hereu2019s your 3-step blueprint on how to analyze open-ended questions from your survey to get the best results.<br>

E N D
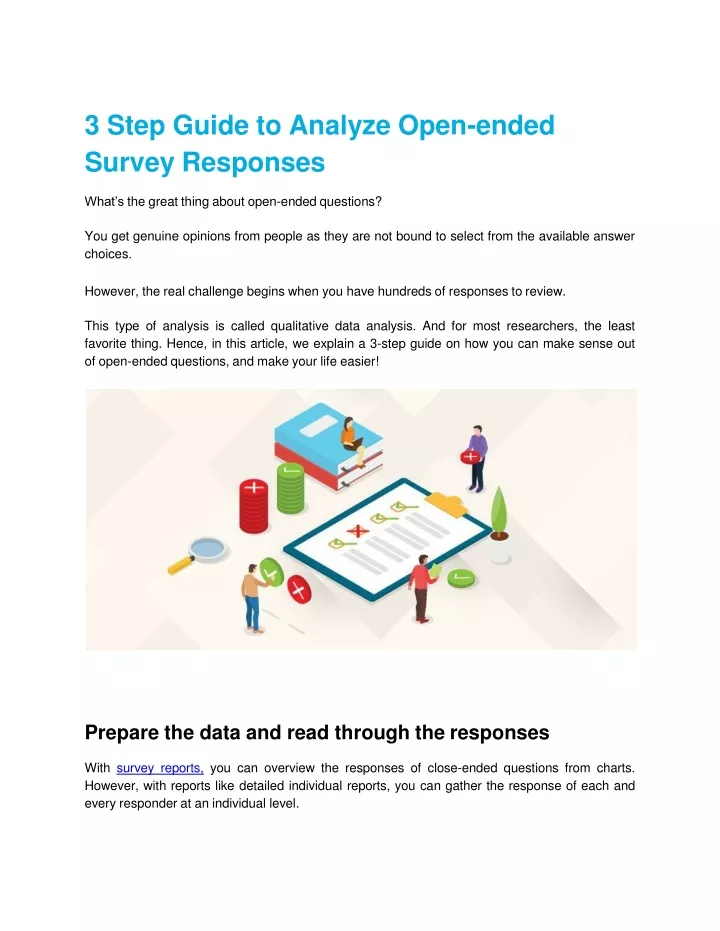
3 Step Guide to Analyze Open-ended SurveyResponses What’s the great thing about open-endedquestions? You get genuine opinions from people as they are not bound to select from the available answer choices. However, the real challenge begins when you have hundreds of responses toreview. This type of analysis is called qualitative data analysis. And for most researchers, the least favorite thing. Hence, in this article, we explain a 3-step guide on how you can make sense out of open-ended questions, and make your lifeeasier! Prepare the data and read through theresponses With survey reports,you can overview the responses of close-ended questions from charts. However, with reports like detailed individual reports, you can gather the response of each and every responder at an individuallevel.
After you have them, start reading. While trying to understand them, make sure to label or categorize them in a way that resonates withyou. • For example, if the feedback is about not receiving responses of tickers, you can use the code “poor customer service” to categorize that response and other responses that communicate a similaridea. • A quick tip: You can use an Excel spreadsheet—add the responses in column A and assign each response code in column B. You can sort column B alphabetically to view which codes appearmost. • You can also divide the responses into categorieslike: • Positive • Neutral • Negative • Subcategorize andrecheck • Subcategorize them only if you find extra details that could help. For example, if you find that not getting a reply to the ticket is something you have received a lot, add it in the negative -- No ticket response. However, you can skip this step because it depends on the replies that you received. • Once you are done, make sure to go back and re-read responses to make sure they fit properly in the categories that you‘ve assigned them. You can also assign multiple categories to one response since open-ended responses tend to cover more than one thingusually. • Quicktips: • Instead of starting with a pre-defined list of codes, let the responses define them for you. Make your list of codes as yougo. • Be consistent. For example, if you use the code "No ticket response" once, keep using it. Don’t mix it up by adding "no responses" to your list ofcodes. It’s time forresults!
Now that you have everything ready, it is time to convert them into quantitative data/percentages. For example, from your survey30% of people had positive things to say, 20% were neutral, and 50% had negativecomments. • Quicktips: • Tally the number of times each code appears to determine keyissues. • In your final report, use verbatims to prepare your findings. Forexample:- • Finding • The customer support system is notresponsive • Verbatim • - "We never get the reply of ourtickers" • Do not forget yourobjective • When analyzing the qualitative data, it is important to keep in mind what your objective is. Were you looking to find out if your customer support is up to the mark? Just like that, write down your objective and work around finding its answer. It will help you gather effectiveanswers. • Power tips for asking open-ended questions for better insights: • Study your open-ended questions. Wherever you feel you can get more information, turn them into open-endedquestions. • After a close-ended question, follow up with an open-ended question. It will help you fetch more information regarding your customers’ choice of a particular close-endedquestion. • Open-ended questions are designed to start conversations. Hence it is important to actively listen to them and act and if possible, revert with asolution. • And that’s it! It may look like a 3-step process, but it is a lot of work! However, keeping your objective in mind will help you in summarizing theresults.
Source :https://www.appjetty.com/blog/3-step-guide-analyze-open-ended-survey-responses