Download
1 / 9
90 likes | 100 Views
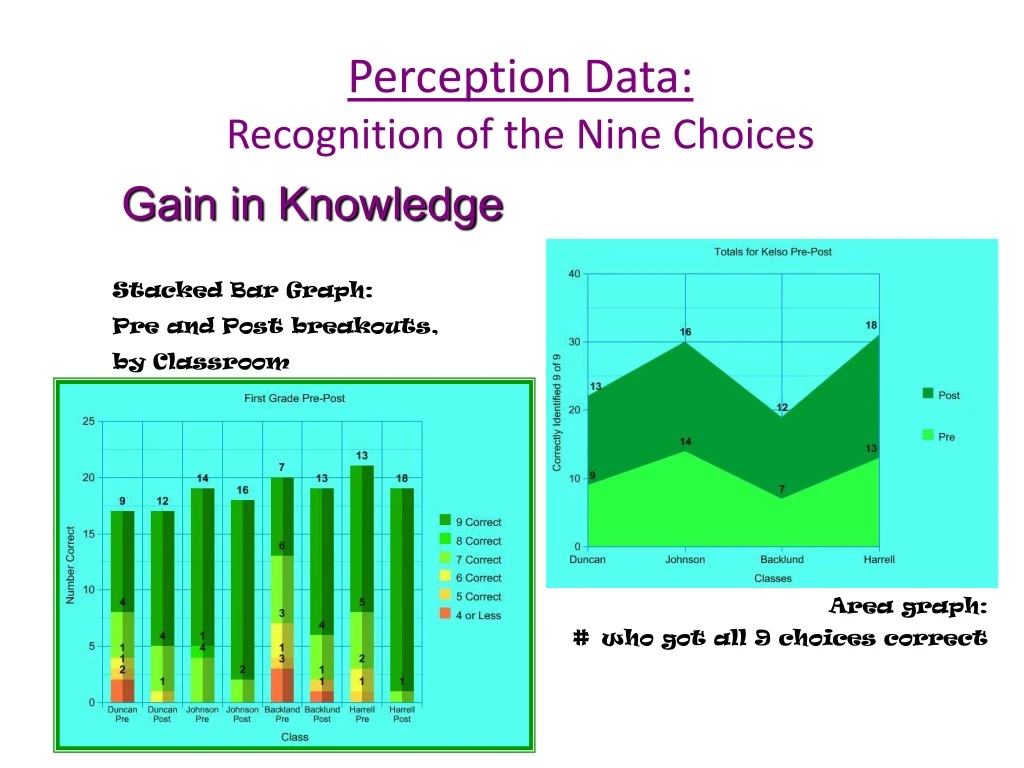
Perception Data: Recognition of the Nine Choices. Gain in Knowledge. Stacked Bar Graph: Pre and Post breakouts, by Classroom. Area graph: # who got all 9 choices correct. Perception Data: Post-Test Recognition of the Nine Choices. A pair of Pie Charts. December 2007 Post-Test

E N D
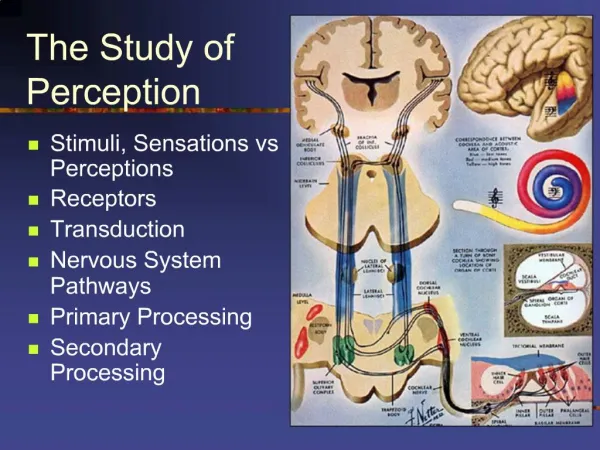
Perception Data:Recognition of the Nine Choices Gain in Knowledge Stacked Bar Graph: Pre and Post breakouts, by Classroom Area graph: # who got all 9 choices correct
Perception Data: Post-TestRecognition of the Nine Choices A pair of Pie Charts December 2007 Post-Test First Graders September 2007 Pre-Test First Graders (most of whom had Kelso in Kindergarten)
Perception Data: Post-TestRecognition of the Nine Choices Kindergarten December 2007
Perception Data: Post-TestRecognition of the Nine Choices Kind. Post-test Dec. 2007
Perception Data: Pre-TestRecognition of the Nine Choices 1st Pre-Test Fall 2008
Perception Data: Post-TestRecognition of the Nine Choices 1st Post-Test Dec. 2008
Outcome Data:Teacher Memo 4 January 2008 Dear Kinder and First Grade Teachers, I have been very pleased with the results of my Kelso pre- and post- test results (see attached—you may keep this info if you’d like). But this only shows what our students learned. NOW I would like your help gathering further data to show whether or not their behavior has actually improved as a result of the Kelso curriculum. I have tried to keep this as simple for you as possible, but feel free to add any additional comments on the reverse side of this sheet. Thanks so much for your help in improving this curriculum. Please mark the two columns according to your perceptions of the students in your class, at the beginning of school, and now, in January. (I may ask again in the spring, to see what students have retained.)
Outcome Data • Teacher reports of behavior change