Download
1 / 18
180 likes | 189 Views
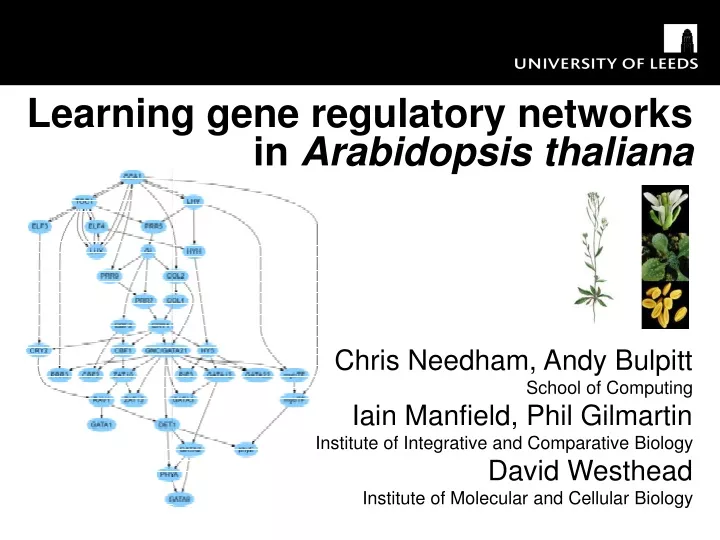
Learning gene regulatory networks in Arabidopsis thaliana Chris Needham, Andy Bulpitt School of Computing Iain Manfield, Phil Gilmartin Institute of Integrative and Comparative Biology David Westhead Institute of Molecular and Cellular Biology. Gene Regulatory Networks.

E N D
Learning gene regulatory networks in Arabidopsis thaliana Chris Needham, Andy Bulpitt School of Computing Iain Manfield, Phil Gilmartin Institute of Integrative and Comparative Biology David Westhead Institute of Molecular and Cellular Biology
Gene Regulatory Networks • GRNs govern the functional development and biological processes of cells in all organisms. • GRNs are a representation that encapsulate all info about gene regulation • Incorporating time, conditions, development • We aim to learn transcription networks for components of Arabidopsis thaliana from gene expression microarray data.
Gene Expression Microarrays transcription translation DNA mRNA protein microarrays genes experiments
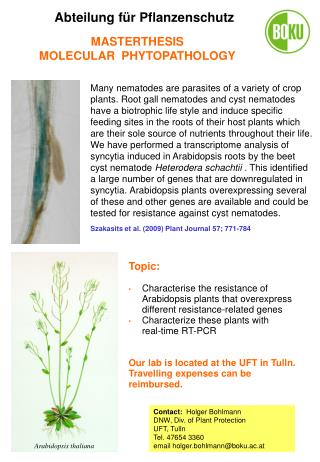
Arabidopsis thaliana • Plants are important • Arabidopsis • is the best annotated plant (poor rel. to yeast) • has excellent large uniform microarray dataset • has a large genome of ~30000 genes with many large gene families – duplications • has many mutants • analysis often not very successful • has many transcription factors (TFs) • what do they do? • even well characterised TFs are not fully-characterised
Arabidopsis GATA Factor genes GATA 2 GATA 4 6.0 5.4 4.8 4.2 3.6 3.0 2.4 1.8 1.2 0.6 0.0 6.0 5.4 4.8 4.2 3.6 3.0 2.4 1.8 1.2 0.6 0.0 0.2x 0.3x GATA 21 GATA 22 6.0 Peak: 20h Peak: 20h 5.0 4.0 Relative expression Relative expression 3.0 2.0 1.0 0.0 0 4 8 12 16 20 24 28 32 36 40 44 48 52 56 ZT ZT L D L D GATA 9 3.0 Peak: 28h 2.5 2.0 Relative expression 1.5 1.0 GATA 22 GATA 21 0.5 8.0 7.2 6.4 5.6 4.8 4.0 3.2 2.4 1.6 0.8 0.0 6.0 5.4 4.8 4.2 3.6 3.0 2.4 1.8 1.2 0.6 0.0 75.3x 7.0x 0.0 0 4 8 12 16 20 24 28 32 36 40 44 48 52 56 ZT GATA 12 3.0 Peak: 28h 2.5 2.0 Relative expression 1.5 GATA 12 GATA 9 2.0 1.8 1.6 1.4 1.2 1.0 0.8 0.6 0.4 0.2 0.0 4.0 3.6 3.2 2.8 2.4 2.0 1.6 1.2 0.8 0.4 0.0 1.0 0.7x 0.5x 0.5 L D L D 0.0 6.0 0 4 8 12 16 20 24 28 32 36 40 44 48 52 56 ZT 5.0 4.0 3.0 2.0 1.0 0.0 0 4 8 12 16 20 24 28 32 36 40 44 48 52 56 L D L D Night-phased Clock regulation Light Up-regulated Day-phased Clock regulation Light Down-regulated Inconsistent Clock regulation of GATA2 and GATA4 between experiments
Biological approach • The experimental biological work involved to discover regulatory networks is hard & expensive: • mutants in TFs • microarray experiments • time course experiments • How do poorly-characterised genes fit into well-characterised networks? such as: • Light up-regulation, Light down-regulation, Clock, Abiotic stress What can we get from the existing data?
Informatics approaches Ordinary Differential Equations – Dynamical Systems Boolean networks – Logical relations between genes Bayesian networks – Modelling a stochastic system Friedman, Inferring cellular networks using probabilistic graphical models. Science 303(6). 2004. Review article. Imoto et al. Combining microarrays and biological knowledge for estimating gene networks via Bayesian networks. CSB 2003. Incorporate prior knowledge from protein-protein interactions, protein-DNA interactions, gene networks and literature. Analysis of Saccharomyces cerevisiae gene expression data newly obtained by disrupting 100 genes, mainly transcription factors. Sachs et al. Causal protein signalling networks derived from multi-parameter single-cell data. Science 308(5721) 2005.
Meaningful gene regulatory networks can be learned from microarray data • without interventions • but using large datasets • publicly available • start to design before extra data collection
Data: Arabidopsis thaliana • 2466 Microarrays (NASC) ~25,000 genes • Filtering • Genes with low entropy are removed. • Can select a subset of genes to consider • Quantisation • Expression signal values discretised into 2 or 3 classes. • Boundaries chosen to create classes with equal probability masses. 825 819 822 GATA2 = AT2G45050 21.9 48.6
Bayesian networks x1 x3 x2 x4 x5 x6 x7 • BNs are a framework for explaining causal relationships consisting of a set of variables connected by a set of directed edges • Probability calculus is used to describe the probabilistic relationship of each variable with its parents • The joint probability distribution over all the variables can be written as a product of conditional probability distributions: p(x1,…xn) = p(xi|pai) where pai are the parents of xi p(x1,…,x7) = p(x1)p(x2)p(x3)p(x4|x1,x2,x3)p(x5|x1,x3)p(x6|x4)p(x7|x4,x5)
Conditional Probability Distributions PIF3 GATA2 GATA4 p(xi|pai) Conditional probability tables for GATA4 Marginal probabilities for GATA4
Structure Learning x1 x3 x2 x4 x5 x6 x7 • Aim is to find the model (network structure) that has the maximum likelihood for a given set of genes (nodes) • For a given set of genes, likelihood L = P(D|S,θS) is the probability of the data D being generated by the model • To search for a good model structure, a greedy learning algorithm is used. From an initial network, edges are added, reversed or deleted until an optimum is reached. Learned structure S = arg maxS {ln p(D|θS,S) – ½ d ln N} The BIC score has a measure of how well the model fits the data, and a penalty term to penalise model complexity. θS is an estimate of the model parameters for the structure S, d is the number of model parameters, and N is the size of the dataset.
Conditional Independence • The different structures encode the conditional independences between the genes. • Causality: the directionality of the arrows can be determined when they lead into a v-structure – the gene at the v depends on all of its parents. • Otherwise, the direction of the causal relation between genes cannot be discovered from data alone. Interventions can be used. • i.e. test using mutants in the respective genes to see which gene is mis-regulated in which mutant. (transcript levels)
Method An initial set of key genes of interest is chosen and a network structure inferred e.g. Circadian clock regulated To this model a number of genes may be added. Genes are added separately… . . . Either all genes, or a selection The structure learning algorithm is applied to each set of genes, finding the GRN which is most likely to have generated the data . . . The best network structure is chosen, and the gene is added to the model
Results Components of “central oscillator” or close to it Cold/salt-stress response genes Down-regulated by light • Meaningful gene regulatory networks can be learned from microarray data • without interventions • but using large datasets • publicly available • start to design before extra data collection
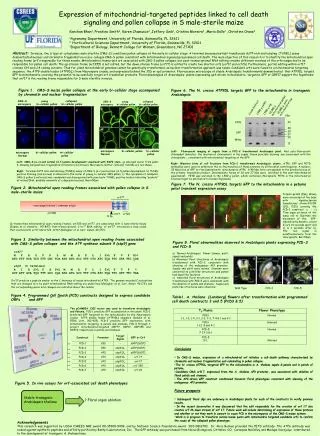
Predictive models Figure 2. Given information about the state of a gene’s expression level (or set of genes), the marginal probability of any other gene (or set of genes) being in a particular state may be calculated. Fixing of the value of a gene (in this case through growing a specific mutant) allows predictions about the likely values of other genes to be made and tested experimentally to verify the predictive model of the GRN. This figure shows the change in marginal likelihood of each gene (y-axis) in Figure 1 when one other gene’s value is fixed (x-axis), based on real data, and the learned network in Figure 1. Dark values show greatest expected change in expression levels, whereas white values show little observable change. Figure 1. Bayesian network of the transcription network for forty genes identified in light/clock regulation of selected GATAs from the literature.
Future Computation • New structure learning algorithms • Strength of connections • Selecting relevant experiments • Effect of discretisation • Sensitivity to noise
Future Biology • We wish to learn GRNs in order to form hypotheses about possible roles of a gene and likely redundant genes. • Main aim is to reduce the number of related genes to be screened for experimental verification of findings. • Look for mis-regulation of genes predicted to be downstream of e.g. well characterised regulators. • Make mutants of poorly characterised genes and look for mis-regulation of gene expression or other phenotype. • Carry these predictions from this model organism to a crop plant, e.g. rice, where many of the regulatory components are conserved.