Download
1 / 44
440 likes | 453 Views
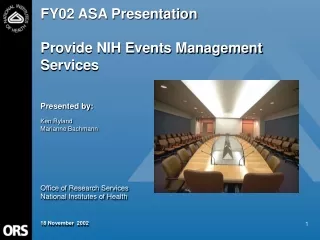
FY02 ASA Presentation Fire Prevention Section, EMB, DPS. Presented by: J.P. McCabe, P.E. Samuel A. Denny, P.E. Robert C. Beller, P.E. Office of Research Services National Institutes of Health 18 November 2002. Table of Contents. Main Presentation

E N D
FY02 ASA Presentation Fire Prevention Section, EMB, DPS Presented by: J.P. McCabe, P.E. Samuel A. Denny, P.E. Robert C. Beller, P.E. Office of Research Services National Institutes of Health 18 November 2002
Table of Contents Main Presentation ASA Template ……………………………….……………………………….4 Customer Perspective……………………….………………………… ….5 Customer Segmentation …………………….……………………………………6 Customer Satisfaction……………………….…………………………………….9 Unique Customer Measures………………….……………………………… ..10 Internal Business Process Perspective………………………………… 12 Service Group Block Diagram…………………………………………………..13 Conclusions from Discrete Services Deployment Flowcharts……………….14 Process Measures………………………………………………………………..15 Learning and Growth Perspective…………………………………………20 Conclusions from Turnover, Sick Leave, Awards, EEO/ER/ADR Data……..21 Analysis of Readiness Conclusions…………………………………………….22 Financial Perspective………………………………………………………..23 Unit Cost……………………………………………………………………………24 Asset Utilization……………………………………………………………………26 Conclusions and Recommendations……………………………………….29 Conclusions from FY02 ASA..……………………………………………………30 Recommendations…………………………………………………………………31
Table of Contents Appendices Page 2 of the FPS ASA Template Customer segmentation graphs Block diagram Process maps Process measures graphs Learning and Growth graphs Analysis of Readiness Information Any unique measures graphs
Customer Segmentation – DS1 • DCAB remains the principal customer, PWB and IC work are less than 10% of the total
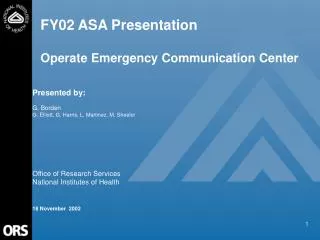
Customer Segmentation – DS2 DS2 - FY02 CustomerSegmentation • FPS inspected all NIH owned buildings in FY 02. • The total area (including local rental space) totals over 12 million sq. ft. • Approximately 3 million sq. ft. (rental space) was not inspected in FY 02. • FPS is adding 2 inspectors in FY 03 to ensure rental space meets requirements. Inspections NIHAC RML 2% 1% GRC 1% Local Rental 25% Bethesda 71%
18 - Non CC Bethesda 22- Rental Buildings 299 - CC Customer Segmentation – DS3 DS3- FY 02 - Fire Training Occurrences • An occurrence represents a training session or drill • Non CC training increased by 100% over FY 01 Customer Segmentation
Customer Satisfaction • FPS measures were not included in the ORS customer scorecard for the current cycle. • FPS has supplemented the ORS customer scorecard with questions aimed at determining AO awareness of the availability of fire safety training.
Unique Customer Measures – DS1 • Both design review and submittal review turnaround times decreased because we’re working more closely with customers
Unique Customer Measures – DS3 (Training) • Post fire drill test scores for CC nursing staff were 100% • The number of staff hours trained outside of the CC increased 100%
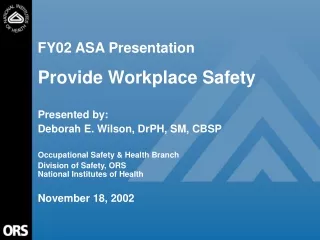
Internal Business Process Perspective • FPS discrete services ensure fire safety in NIH facilities by examining: • new construction (DS1 – design reviews and construction inspections); • code compliant usage of operating facilities (DS2 – inspections of existing conditions); and • fire safety awareness (DS3 – training) Review designs and inspect new construction and/or alterations to ensure that NIH buildings comply with all regulatory requirements Inspect existing buildings to ensure that they continue to comply with regulations Train and educate NIH staff regarding fire safety
Internal Business Process Perspective - Deployment Flowcharts • FPS has completed deployment flowcharts for the three discrete services (see Appendix). • A problem was noted for DS1 in that there is no mechanism to ensure that designs are reviewed and new work inspected before occupancy. • A similar problem was noted for DS2 in that there are no means to ensure that deficiencies are corrected in a timely manner. • Accountability must be addressed – see recommendation on Slide 31.
Internal Business Process Perspective – Process Measures • The process measures established for each discrete service are: • DS1: % of construction projects reviewed during design and inspected during construction. • DS2: Benchmark fire inspector staffing levels with current DOD standards. • DS3: Monitor the staff hours trained outside of the Clinical Center.
Internal Business Process Perspective – DS1 Process Measure • FPS mission is to ensure all new construction and renovations are code compliant. • FPS has been involved in the design and construction of all major projects. • Smaller jobs have the potential to create fire protection deficiencies but there is no mechanism to ensure these are reviewed. • FPS and DES continue to seek a method to prevent this from happening, however, the next slide shows the scope of the problem.
Internal Business Process Perspective • FPS has examined the list of projects in SSFAS (see chart) and found the FPS review percentage to be 32%. • Applying this to the total DES workload of ~555 projects (a figure supplied by DES) shows agreement with actual number of reviews by FPS since: -174 unique projects were reviewed by FPS - 32% of 555 is 178 projected reviews.
Internal Business Process Perspective – DS2 Process Measure • Current (end of FY02) total square footage at Bethesda, Poolesville, GRC, RML and local leased space is 12.7 million sq. ft. • After hiring two additional inspectors (currently in-progress), NIH will meet DOD staffing requirements
Conclusions from Turnover, Sick Leave, Awards, EEO/ER/ADR Data • Analysis of the FPS Learning and Growth Data indicates there are no areas of concern.
Analysis of Readiness Conclusions • FPS is currently well trained, adequately staffed and equipped for the review work received and for inspecting Government owned facilities. • A plan is in place which, if implemented, ensures adequate staffing, training and equipment over the next few years to review/inspect all designs and construction and to inspect leased facilities in the metropolitan area.
Unit Cost Measures • FPS FTEs are assigned as follows: - DS1 (construction reviews/inspections): 3 (contract) engineers and 1 inspector - DS2 (routine inspections/consultations): 1 engineer and 2 inspectors - DS3 (training): 1 inspector • Section-wide costs (Section Chief, Admin. Asst., training costs, vehicle, supplies, etc.) were divided equally among the three discrete services
Unit Cost Measures • Budget data could not be obtained to perform the Unit Cost Calculations. • The Unit Cost Calculation Procedure appears in the Appendix.
Asset Utilization – DS1 (Engineering Reviews) • Unit Output • Design Reviews: 5.4 hours for reports, 10 hours total • Submittal Reviews: 1.6 hours for reports, 4 hours total • Inspections: 2.4 hours for report, 5 hours total • Staffing – 7360 hours (4 FTEs) • Production hours – 5888 (assume 20% of time used for training, staff meetings, and other admin. duties) • Design Reviews: 60% or 3533 hours • Submittal Reviews and Inspections: 20% or 1177 hours each • Production Capacity • Design Reviews: 3533 hours / 10 hours per review = 353 reviews • Submittal Reviews: 1177 hours / 4 hours per review = 294 reviews • Inspections: 1177 hours / 5 hours per inspection = 235 inspections • Asset Utilization • Design Reviews: 288/353 = 82% • Submittal Reviews: 285/294 = 97% • Inspections: 166/235 = 71%
Asset Utilization – DS2 • Unit Output • Inspections/Consultations: 3 hours • Hazardous Work Permits: 0.5 hours • Production Capacity – 5220 hours (3 FTEs) • Inspections/Consultations : 88% or 4594 hours • Hazardous Work Permits: 12% or 626 hours • Production Hours • Inspections/Consultations: 3032 hours recorded • Hazardous Work Permits: 425 hours / 0.5 hrs = 850 permits • Asset Utilization • Inspections/Consultations: 3032/4594 = 66% • Hazardous Work Permits: 425/626 = 68%
Asset Utilization – DS3 • Unit Output • Fire Safety Awareness Training Session: 1.5 hours • Production hours – 1740 hours (1 FTE) • FPS assumed 1 Fire Inspector FTE applicable to this discrete service • Production Capacity • Training sessions: 1740 hours / 1.5 hrs = 1160 units • Asset Utilization • Inspections/Consultations: 339/1160 = 29% • FPS needs to promote utilization of training services
Conclusions from FY02 ASA The Good News • After filling the approved additional contract engineer position, FPS will have the capacity to handle an increase in design reviews and inspections. • After filling the approved two additional Fire Inspector positions, the FPS will be able to inspect all leased buildings in the metropolitan area. The Other News • There are a significant number of designs not being reviewed as well as projects not being inspected before occupancy. • There is no mechanism to ensure the correction of violations documented during the routine building inspections.
Recommendations • FPS recommends that NIH establish design approval and beneficial occupancy permits similar to those in use in local jurisdictions. • Develop a tracking system for the correction of violations – this will become a process measure. • Improve internal record keeping of the hours spent on design and construction inspection outside of the formal report issuance stage (e.g., design review meetings, construction progress meetings, etc.).
Customer Segmentation Graphs – DS2 NIHAC RML 2% 1% GRC 1% Local Rental 25% Bethesda 71%
18 - Non CC Bethesda 22- Rental Buildings 299 - CC Customer Segmentation Graphs – DS3
FPS Discrete Services Block Diagram Review designs and inspect new construction and/or alterations to ensure that NIH buildings comply with all regulatory requirements Inspect existing buildings to ensure that they continue to comply with regulations Train and educate NIH staff regarding fire safety
Analysis of Readiness Information ·Skills and abilities: -Certified fire inspectors -Licensed engineers in fire protection -Analytic skills -Oral and written communication -Training -Computer literacy ·Numbers/skills/abilities in three years -No expected gaps in skills -We are projecting that we will need to hire 2 new entry-level inspectors -We are expecting to add one contract engineer in ’03, one in ‘04 -With 6 inspectors and 6 engineers, staff should be adequate through ’04. ·Training needs, next 3 years -For new inspectors, 1 year of training in inspection and fire investigation, leading to certification. -For one contract engineer, professional licensing exam ·Tools or materials needs, next three years -Will need additional vehicle to transport training aids around campus -Will need computers and supplies for two new inspectors in ’03, one contract engineer in 03, one in ’04. ·Tools or materials adequacy -With items listed above, we will have what we need. ·Implications of not obtaining needed resources -We won’t be able to cover requests for burn permits -Inspections will be delayed -Turnaround times for design reviews will stretch out -We will need to contract out our fire investigations
Unit Cost Calculation Procedures • DS1 cost - $ (1/3rd + 550K + 48,250) is divided 60-20-20 across the three distinct production unit types so unit costs are: • -0.60 x $(above)/288 design reviews = $ per design review • - 0.20 x $(above)/285 submittal reviews = $ per submittal review • - 0.20 x $(above)/166 inspections = $ per inspection • DS2 cost - $ (1/3rd + 87K + 96,500) is divided 88-12 across the two distinct production unit types so unit costs are: • - 0.88 x $(above)/??? Inspections/Consultations = $ per unit • - 0.12 x $(above)/??? Hazardous work permits = $ per permit • DS3 cost - $ (1/3rd + 48,250) / 339 training sessions = $ per unit