Download
1 / 8
80 likes | 90 Views
Writing and Graphing Inequalities. Because “ I<3U ” does not mean “ I love you. ” Mathematically, it means I less than 3 of you. What is an inequality?. Mathematical sentence that compares quantities.

E N D
Writing and Graphing Inequalities Because “I<3U” does not mean “I love you.” Mathematically, it means I less than 3 of you.
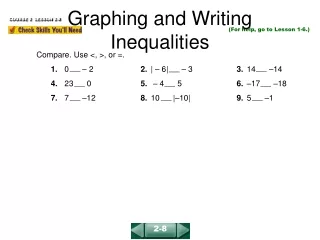
What is an inequality? • Mathematical sentence that compares quantities. • To solve an inequality, you have to find all values for the variable that make the sentence true. • Inequalities do not contain equal signs.
Translating sentences to inequalities • Example 1: A number is less than 2. Since we don’t know what the number is, we will use x to represent the unknown number. x < 2 • Example 2: The cost of the shirt exceeds $15. x > 15 Exceeds means “is greater than.”
Example 3: The maximum number of students in the class is 28. • Example 4: The weight of the package was no less than 50 pounds. Maximum means that there could be 28 students or less in the class. x ≤ 28 If something is no less than 50, it could be greater than or equal to 50. x ≥ 50
To graph an inequality on a number line: • Draw a number line, and mark the critical point near the center of the number line. • Frame the critical point by filling in a number to the left and the right. • Put a circle on the critical point. • Shade in the circle for inequality symbols ≥ and ≤ . • Leave the circle open (unshaded) for inequality symbols >, <, and ≠ . • Draw a shaded arrow towards the part of the number line that makes the inequality statement true.
Examples of Graphing Inequalities Example 1: x > 2 Example 2: x < -6 2 1 3 -6 -7 -5
Example 3: x ≤ 28 Example 4: x ≥ -4 29 27 28 -4 -5 -3