Download
1 / 14
140 likes | 148 Views
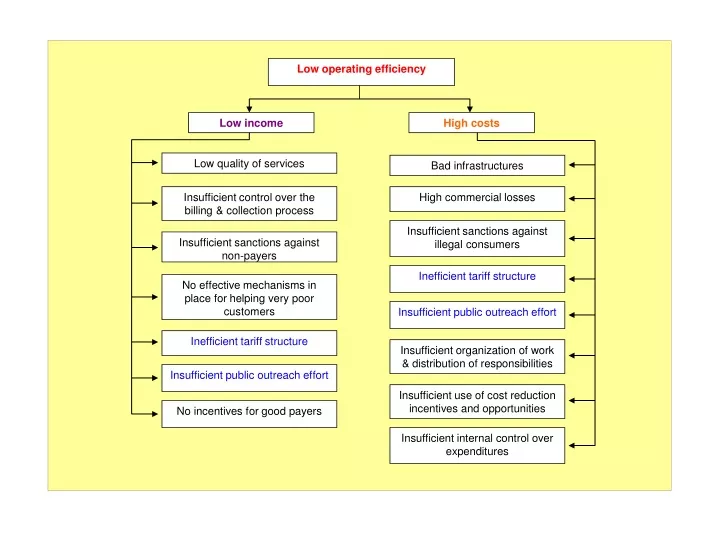
Low operating efficiency. Low income. High costs. Low quality of services. Bad infrastructures. Insufficient control over the billing & collection process. High commercial losses. Insufficient sanctions against illegal consumers. Insufficient sanctions against non-payers.

E N D
Low operating efficiency Low income High costs Low quality of services Bad infrastructures Insufficient control over the billing & collection process High commercial losses Insufficient sanctions against illegal consumers Insufficient sanctions against non-payers Inefficient tariff structure No effective mechanisms in place for helping very poor customers Insufficient public outreach effort Inefficient tariff structure Insufficient organization of work & distribution of responsibilities Insufficient public outreach effort Insufficient use of cost reduction incentives and opportunities No incentives for good payers Insufficient internal control over expenditures
OBP Eligible customer allocation services payment Water Company service bill
Responsibilities of Controllers • Reading of customers’ meters; • Notification of customers; • Detection of illegal connections; • Detection of ‘hidden’ customers; • Detecting cases of tempering or malfunction of meters; • Listening to the customers’ complaints/proposals and communicating them to the Company’s management; • Assisting the analytical units of the Company in carrying out different customer surveys.
Methodology for Calculating Bonus Payments • A fixed monthly salary, and • A performance-based quarterly bonus calculated as: QB = QBmax (I1 + I2 + I3 + … + In).
Proposed indicators for calculation of the QB • Improvement of the collection rate (ICR); max = 0.4 • Reduction of commercial losses (RCL); max 0.4 • Improvement of commercial efficiency (ICE); max 0.3 • Timeliness of monthly payments (TMP); max 0.3 • Service area difficulty level (SAD); max 0.2
Where: CR is the collection rate in the controller’s service area in the current period; CR start is the collection rater in the controller’s service area at the moment of employment of the controller.
Where: NAS is the number of active (that make payments) subscribers in the controller’s service area in the current period; NAS start is the number of active subscribers in the controller’s service area at the moment of employment of the controller. TNS is the total number of subscribers in the controller’s service area.
Where: C is the total collection in the controller’s service area in the current period; C start is total collection in the controller’s service area at the moment of employment of the controller. B start is the total bill in the controller’s service area at the moment of employment of the controller.
Where: TP is the number of timely payments (the payments made by the subscribers in agent banks or post offices before the deadline specified in the service contracts) in the controller’s service area in the current period; TP start is the number of timely payments in the controller’s service area at the moment of employment of the controller. NAS is the number of active subscribers in the controller’s service area in the current period.
Where: TD is the total distance (starting from the sector office) that the controller should pass to visit all the subscribers in the controller’s service area; TNS is the total number of subscribers in the controller’s service area. AD is the average distance calculated for all the service areas of the Company. ANS is the average number of subscribers calculated for all the service areas of the Company.
Publications • Informing the customers of the company on: • The general performance of the company; • The main problems and difficulties faced by the company; • The quality of services and the planned improvements; • Contacts of the company’s customer service centers in different regions, and the procedures for application; • Changes in the legal and regulatory framework; • The support provided to the company by different donors or government agencies; • Etc. • “Naming and shaming” those customers of the company that do not pay for the services or consume the water illegally, thus endangering the continuity of water supply for other customers.
Investment efficiency Where: ‘IE’ is the investment efficiency, ‘PAS’ is the planned annual saving, ‘RI’ is the total amount of required investment, ‘EL’ is the estimated lifetime of the acquired asset or the duration of the cost-saving effect of the investment in years, ‘O&M’ is the annual cost required for operation and maintenance of the asset (including taxes and duties if any), ‘IR’ is the interest rate on invested capital.