Download
1 / 111
1.13k likes | 1.25k Views
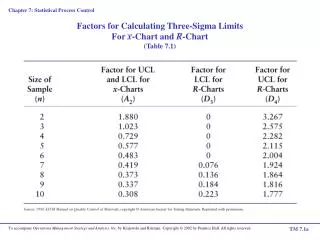
Chapter 7 - Statistical Process Control. Common Causes. Common Causes. Figure 7.1. Common Causes. Figure 7.1. Common Causes. 425 Grams. Figure 7.1. Assignable Causes. Average. Grams. Assignable Causes. (a) Location. Figure 7.2. Average. Grams. Assignable Causes.

E N D
Common Causes Figure 7.1
Common Causes Figure 7.1
Common Causes 425 Grams Figure 7.1
Average Grams Assignable Causes (a) Location Figure 7.2
Average Grams Assignable Causes (a) Location Figure 7.2
Average Assignable Causes Grams (a) Location Figure 7.2
Average Grams Assignable Causes (b) Spread Figure 7.2
Average Grams Assignable Causes (b) Spread Figure 7.2
Average Grams Assignable Causes (c) Shape Figure 7.2
Average Grams Assignable Causes (c) Shape Figure 7.2
Effects of Assignable Causes on Process Control Out of control (assignable causes present) Figure 7.3 (a)
Effects of Assignable Causes on Process Control In Control (no assignable causes) Figure 7.3 (b)
Mean Process distribution 425 Grams Sample Means and the Process Distribution Figure 7.4
Mean Distribution of sample means 425 Grams Sample Means and the Process Distribution Process distribution Figure 7.4
The Normal Distribution Figure 7.5
The Normal Distribution = Standard deviation Mean Figure 7.5
The Normal Distribution = Standard deviation Mean –1 +1 68.26% Figure 7.5
The Normal Distribution = Standard deviation Mean –2 –1 +1 +2 68.26% 95.44% Figure 7.5
The Normal Distribution = Standard deviation Mean –3 –2 –1 +1 +2 +3 68.26% 95.44% 99.74% Figure 7.5
Control Charts UCL Nominal LCL Figure 7.6
Control Charts UCL Nominal LCL 1 2 3 Samples Figure 7.6
Control Charts UCL Nominal LCL 1 2 3 Samples Figure 7.6
Control Charts UCL Nominal LCL Assignable causes likely 1 2 3 Samples Figure 7.6
Using Control Charts for Process Improvement • Measure the process • When changes are indicated, find the assignable cause • Eliminate problems, incorporate improvements • Repeat the cycle
Control Chart Examples UCL Nominal Variations LCL Sample number Figure 7.7 (a)
Control Chart Examples UCL Nominal Variations LCL Sample number Figure 7.7 (b)
Control Chart Examples UCL Nominal Variations LCL Sample number Figure 7.7 (c)
Control Chart Examples UCL Nominal Variations LCL Sample number Figure 7.7 (d)
Control Chart Examples UCL Nominal Variations LCL Sample number Figure 7.7 (e)
Control Limits and Errors UCL Process average LCL Three-sigma limits Figure 7.8 (a)
Control Limits and Errors Type I error: Probability of searching for a cause when none exists UCL Process average LCL Three-sigma limits Figure 7.8 (a)
Control Limits and Errors Type I error: Probability of searching for a cause when none exists Type II error: Probability of concluding that nothing has changed UCL Shift in process average Process average LCL Three-sigma limits Figure 7.8 (a)
Control Limits and Errors UCL Process average LCL Two-sigma limits Figure 7.8 (b)
Control Limits and Errors Type I error: Probability of searching for a cause when none exists UCL Process average LCL Two-sigma limits Figure 7.8 (b)
Control Limits and Errors Type I error: Probability of searching for a cause when none exists Type II error: Probability of concluding that nothing has changed UCL Shift in process average Process average LCL Two-sigma limits Figure 7.8 (b)
Control Charts for Variables West Allis Industries Example 7.1
Control Charts for Variables Special Metal Screw Sample Sample Number 1 2 3 4 1 2 3 4 5 Example 7.1
Control Charts for Variables Special Metal Screw Sample Sample Number 1 2 3 4 1 0.5014 0.5022 0.5009 0.5027 2 0.5021 0.5041 0.5024 0.5020 3 0.5018 0.5026 0.5035 0.5023 4 0.5008 0.5034 0.5024 0.5015 5 0.5041 0.5056 0.5034 0.5047 Example 7.1
Control Charts for Variables Special Metal Screw Sample Sample Number 1 2 3 4 Rx 1 0.5014 0.5022 0.5009 0.5027 2 0.5021 0.5041 0.5024 0.5020 3 0.5018 0.5026 0.5035 0.5023 4 0.5008 0.5034 0.5024 0.5015 5 0.5041 0.5056 0.5034 0.5039 _ Example 7.1
Control Charts for Variables Special Metal Screw Sample Sample Number 1 2 3 4 Rx 1 0.5014 0.5022 0.5009 0.5027 2 0.5021 0.5041 0.5024 0.5020 3 0.5018 0.5026 0.5035 0.5023 4 0.5008 0.5034 0.5024 0.5015 5 0.5041 0.5056 0.5034 0.5039 _ Example 7.1
Control Charts for Variables Special Metal Screw Sample Sample Number 1 2 3 4 Rx 1 0.5014 0.5022 0.5009 0.5027 2 0.5021 0.5041 0.5024 0.5020 3 0.5018 0.5026 0.5035 0.5023 4 0.5008 0.5034 0.5024 0.5015 5 0.5041 0.5056 0.5034 0.5039 _ 0.5027 – 0.5009 = 0.0018 Example 7.1
Control Charts for Variables Special Metal Screw Sample Sample Number 1 2 3 4 Rx 1 0.5014 0.5022 0.5009 0.5027 0.0018 2 0.5021 0.5041 0.5024 0.5020 3 0.5018 0.5026 0.5035 0.5023 4 0.5008 0.5034 0.5024 0.5015 5 0.5041 0.5056 0.5034 0.5039 _ 0.5027 – 0.5009 = 0.0018 Example 7.1
Control Charts for Variables Special Metal Screw Sample Sample Number 1 2 3 4 Rx 1 0.5014 0.5022 0.5009 0.5027 0.0018 0.5018 2 0.5021 0.5041 0.5024 0.5020 3 0.5018 0.5026 0.5035 0.5023 4 0.5008 0.5034 0.5024 0.5015 5 0.5041 0.5056 0.5034 0.5039 _ 0.5027 – 0.5009 = 0.0018 (0.5014 + 0.5022 + 0.5009 + 0.5027)/4 = 0.5018 Example 7.1
Control Charts for Variables Special Metal Screw Sample Sample Number 1 2 3 4 Rx 1 0.5014 0.5022 0.5009 0.5027 0.0018 0.5018 2 0.5021 0.5041 0.5024 0.5020 3 0.5018 0.5026 0.5035 0.5023 4 0.5008 0.5034 0.5024 0.5015 5 0.5041 0.5056 0.5034 0.5039 _ 0.5027 – 0.5009 = 0.0018 (0.5014 + 0.5022 + 0.5009 + 0.5027)/4 = 0.5018 Example 7.1
Control Charts for Variables Special Metal Screw Sample Sample Number 1 2 3 4 Rx 1 0.5014 0.5022 0.5009 0.5027 0.0018 0.5018 2 0.5021 0.5041 0.5024 0.5020 0.0021 0.5027 3 0.5018 0.5026 0.5035 0.5023 0.0017 0.5026 4 0.5008 0.5034 0.5024 0.5015 0.0026 0.5020 5 0.5041 0.5056 0.5034 0.5047 0.0022 0.5045 _ Example 7.1