Download
1 / 42
1.26k likes | 3.18k Views
hyperbola. Jeff Bivin -- LZHS. hyperbola applet. Graph : Graph and locate the foci. Text Example. Solution . We see that h = 2 and k = 3. Thus, the center of the hyperbola, ( h , k ), is ( 2, 3). 8. 7. 6. 5.

E N D
hyperbola Jeff Bivin -- LZHS
Graph: Graph and locate the foci. Text Example Solution We see that h = 2 and k = 3. Thus, the center of the hyperbola, (h, k), is (2, 3).
8 7 6 5 a = 4 a = 4 4 3 (-2, 3) (6, 3) (2, 3) 2 1 -5 -4 -3 -2 -1 1 2 3 4 5 6 7 8 9 10 -1 Solution Step 1 Locate the vertices. To do this, we must identify a2. Text Example cont. Because a2 = 16, a = 4. This means that the vertices are 4 units to the right and left of the center, (2, 3). Four units to the right of (2, 3) puts one vertex at (6, 3). Four units to the left puts the other vertex at (-2, 3).
8 7 6 5 4 (-2, 3) (6, 3) 3 (2, 3) 2 1 -5 -4 -3 -2 -1 1 2 3 4 5 6 7 8 9 10 -1 Solution Step 2Draw a rectangle. Because a2 = 16 and b2 = 9, a = 4 and b = 3. The rectangle passes through points that are 4 units to the right and left of the center (the vertices are located here) and 3 units above and below the center. The rectangle is shown using dashed lines. Text Example cont.
8 7 6 5 4 (-2, 3) (6, 3) 3 (2, 3) 2 1 -5 -4 -3 -2 -1 1 2 3 4 5 6 7 8 9 10 -1 Solution Step 3Draw extended diagonals of the rectangle to obtain the asymptotes. We draw dashed lines through the opposite corners of the rectangle to obtain the graph of the asymptotes. The equations of the asymptotes of the hyperbola are y - 3 = 3/4 (x - 2) Text Example cont.
8 7 6 5 4 (-2, 3) (6, 3) 3 (2, 3) 2 1 -5 -4 -3 -2 -1 1 2 3 4 5 6 7 8 9 10 -1 Solution Step 4Draw the two branches of the hyperbola by starting at each vertex and approaching the asymptotes. The hyperbola is shown below. The foci are located c units to the right and left of the center. We find c using Because c = 5 the foci are 5 units to the right and left of the center, (2, 3). Five units to the right of (2, 3) puts one focus at (7, 3). Five units to the left of the center puts the other focus at (-3, 3). Text Example cont.
Equation Center Transverse Axis Foci Vertices (h, k) Parallel to the x-axis, horizontal (h – c, k) (h + c, k) (h – a, k) (h + a, k) (h, k) Parallel to the y-axis, vertical (h, k – c) (h, k + c) (h, k – a) (h, k + a) y Vertex (h + a, k) Focus (h – c, k) Focus (h + c, k) (h, k) Focus (h + c, k) (h, k) Vertex (h + a, k) Vertex (h – a, k) Vertex (h + a, k) x x Focus (h – c, k) Standard Forms of Equations of Hyperbolas Centered at (h,k)
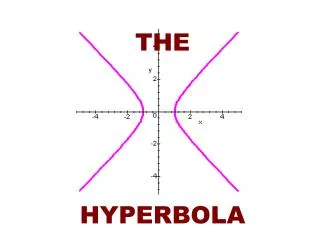
Hyperbola • The set of all points whose difference of the distances from two fixed points (foci) are constant. foci foci Jeff Bivin -- LZHS
Hyperbola conjugate axis vertex vertex transverse axis Co-vertices endpoints ofconjugate axis Jeff Bivin -- LZHS
y y (0, c) Transverse axis (-a, 0) Transverse axis (a, 0) (0, a) x x (-c, 0) (c, 0) (0, -a) (0, -c) Note: If x is first, opens sideways If y is first, opens vertically Standard Forms of the Equations of a Hyperbola • The standard form of the equation of the hyperbola with center at the origin is • To find c: Note: a2 is always first
Graphing Hyperbolas • Locate the center and vertices. • Use dashed lines to draw the rectangle. • Use dashed lines to draw the diagonals of this rectangle and extend them to obtain the asymptotes. • Draw the two branches of the hyperbola by starting at each vertex and approaching the asymptotes.
Graph the Hyperbola Center: (0, 0) a = 3 in x direction b = 4 in y direction c = 5 (0, 4) 4 (0, 0) (-3, 0) (3, 0) 3 3 4 (0, -4) Jeff Bivin -- LZHS
Graph the Hyperbola C(0, 0) b = 1 a = 2 (0, 2) 2 (0, 0) (-1, 0) (1, 0) 1 1 2 (0, -2) Jeff Bivin -- LZHS
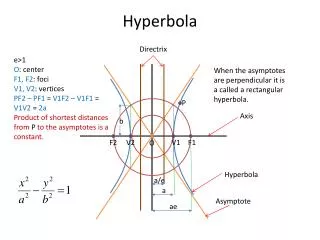
Hyperbola • Center ( ) • a • b • c • Foci ( ) • Vertices ( ) • Asymptotes y = • Length of transverse and conjugate axes • Eccentricity • Directrices y = or x =
Graph the following Hyperbola Watch sign! 4x2 + 8x - 9y2 + 54y - 53 = 168 (4x2 + 8x ) - (9y2 - 54y ) = 168 + 53 4(x2 + 2x + 1) - 9(y2 - 6y + 9) = 221 + 4 - 81 4(x + 1)2 - 9(y - 3)2 = 144 144 144 144 36 16 Jeff Bivin -- LZHS
Eccentricity • The eccentricity of a hyperbola is > 1
The Asymptotes of a Hyperbola Centered at the Origin The hyperbola opens horizontally and has two asymptotes The hyperbola opens vertically and has two asymptotes OR you can remember that you are just doing slope which will always be y value over x value
Asymptotes • To find asymptotes of hyperbolas that are not centered at (0,0), just use point-slope formula: where is the Center and m= ± a/b or b/a Example: center (3,1) m=5/2
Graph the Hyperbola C(0, 0) b = 4 foci = (5,0) (-5,0) a = 3 c = 5 vertices = (3,0) (-3,0) transverse axis = 6 converse axis = 8 asymptotes: eccentricity: directrices: Jeff Bivin -- LZHS
Graph the Hyperbola C(0, 0) b = 1 foci = (0, ) (0,- ) a = 2 vertices = (0,2) (0,-2) transverse axis = 4 converse axis = 2 Jeff Bivin -- LZHS
Graph the Hyperbola Center: (-2, 3) a = 6 in y direction b = 3 in x direction (-2, 9) 6 (-2, 3) (-5, 3) 3 3 (1, 3) 6 (-2, -3) Jeff Bivin -- LZHS
Graph the following Hyperbola Center: (-2, 3) a = 6 b = 3 (-2, 9) 6 foci (-2, 3) (-5, 3) 3 3 (1, 3) 6 (-2, -3)
Graph the following Hyperbola Asymptotes (-2, 9) 6 (-2, 3) (-5, 3) 3 3 (1, 3) 6 (-2, -3)
Graph the following Hyperbola Asymptotes (-2, 9) 6 (-2, 3) (-5, 3) 3 3 (1, 3) 6 (-2, -3)
Graph the Hyperbola Eccentricity (-2, 9) 6 (-2, 3) (-5, 3) 3 3 (1, 3) 6 (-2, -3)
Graph the following Hyperbola Center: (3, -2) Vertices: (1, 3) (-5, 3) Co-Vertices: (-2, -3) (-2, 9) Foci: (-2, 9) Length of Transverse axis: 12 6 Length of Conjugate axis: 6 (-2, 3) Asymptotes (-5, 3) 3 3 (1, 3) 6 (-2, -3) Jeff Bivin -- LZHS
Graph the following Hyperbola Center: (-1, 5) a = 4 in x direction b = 7 in y direction (-1, 12) 7 (-1, 5) (-5, 5) 4 4 (3, 5) 7 (-1, -2) Jeff Bivin -- LZHS
Graph the following Hyperbola Center: (-1, 5) a = 4 b = 7 (-1, 12) 7 foci (-1, 5) (-5, 5) 4 4 (3, 5) 7 (-1, -2) Jeff Bivin -- LZHS
Graph the Hyperbola C (-1, 5) a = 4 b = 7 foci: Vertices: (3,5) (-5,5) (-1, 12) 7 (-1, 5) (-5, 5) 4 4 (3, 5) 7 (-1, -2) Jeff Bivin -- LZHS
Asymptotes Graph the Hyperbola (-1, 12) 7 (-1, 5) (-5, 5) 4 4 (3, 5) 7 (-1, -2)
Graph the following Hyperbola Center: (-1, 3) a = 6 in x direction (-1, 7) b = 4 in y direction 4 (-1, 3) 6 6 (-7, 3) (3, 5) 4 (-1, -1) Jeff Bivin -- LZHS
Graph the following Hyperbola Center: (-1, 3) a = 6 b = 3 foci (-1, 7) 4 (-1, 3) 6 6 (-7, 3) (5, 3) 4 (-1, -1) Jeff Bivin -- LZHS
Graph the Hyperbola Eccentricity (-1, 7) 4 (-1, 3) 6 6 (-7, 3) (5, 3) 4 (-1, -1) Jeff Bivin -- LZHS
Graph the following Hyperbola Asymptotes (-1, 7) 4 (-1, 3) 6 6 (-7, 3) (5, 3) 4 (-1, -1) Jeff Bivin -- LZHS
Graph the following Hyperbola Asymptotes (-1, 7) 4 (-1, 3) 6 6 (-7, 3) (5, 3) 4 (-1, -1) Jeff Bivin -- LZHS
Graph the following Hyperbola Center: (-1, 3) Vertices: (-7, 3) (5, 3) Co-Vertices: (-1, 7) (-1, -1) Foci: (-1, 7) Length of Transverse axis: 12 4 Length of Conjugate axis: 8 (-1, 3) Asymptotes 6 6 (-7, 3) (5, 3) 4 (-1, -1) Jeff Bivin -- LZHS