Download
1 / 29
310 likes | 480 Views
i-Tree Eco Analyses in the GTA Evaluating the Ecosystem Services Provided by Our Urban Forests. Outline. Introduction to i-Tree Eco Collaboration on GTA studies Toronto study results GTA study results Next steps. Rationale for i-Tree Eco Studies.

E N D
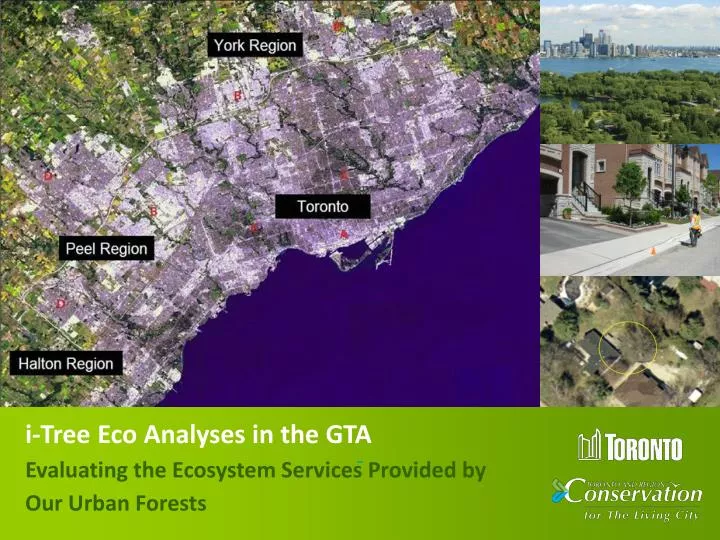
i-Tree Eco Analyses in the GTAEvaluating the Ecosystem Services Provided by Our Urban Forests
Outline • Introduction to i-Tree Eco • Collaboration on GTA studies • Toronto study results • GTA study results • Next steps
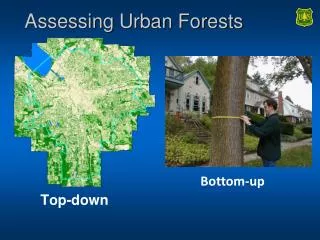
Rationale for i-Tree Eco Studies • USDA Forest Service i-Tree suite provides science-based analysis and benefits assessment tools • Eco uses field plots, air pollution and meteorological data to quantify urban forest structure, environmental effects and value • Generates baseline data that can inform management decisions, policy and strategic planning www.itreetools.org
GTA i-Tree Collaboration • 2008 TRCA joint planning session • i-Tree experts, researchers, users from GTA and other Ontario municipalities • Harmonized study design & methodologies • Potential for consolidating data in future • Opportunity to raise profile of urban forests • Connected UF professionals across the GTA
Field data collection (407 plots) i-Tree Eco data analysis (USDA) basics i-Tree Hydro, Grow Out modeling Forest & land cover change analysis Digital land cover map Street tree data extras Toronto Study Elements • In Toronto: i-Tree Eco “plus…” 1999 plus 2005 Measuring land cover change using orthophotos Automated land cover classification using 0.6m Quickbird satellite imagery
*Tree canopy is approximately 20% Goal: Achieve & maintain between 30-40% Toronto’s tree cover is average compared to cities of similar size. Toronto’s urban forest is a vital city asset with a replacement value of $7 billion.
Distribution of Tree CoverGoal: More even/equitable distribution of tree cover Average tree cover by ward Average tree cover by neighbourhood • Distribution of tree cover is uneven • Data can be used to prioritize planting areas
Ownership 60% located on private property 34% located in City parks and natural areas 6% located in City road allowances Private property owners control a majority of the City’s existing and possible tree canopy.
Land Use Affects Tree CanopyGoal: Improve distribution & quality of tree cover • Land use affects • Distribution of forest cover • Species composition & diversity • Average tree size
Land/Forest Cover Change (*preliminary) Biggest change in neighbourhoods (-1.3%) Tree Cover -0.7%
Forest Composition & ConditionGoal: High diversity, appropriate species, healthy trees • Good species diversity overall - 144 species & cultivars • Exception - maple & ash (41%) • Majority of trees are in good condition (exception: street trees)
Forest Size Class Structure Goal: Maintain regeneration, reduce mortality, increase % mid- to large-size trees increase • Number of large trees relative to small is low • Have good regeneration, but • Large trees provide maximum benefits
Value of Ecological Services Provided by Toronto’s Urban Forest Annual equivalent value = $60 million+ • Carbon storage = 1.1 million tonnes • Carbon sequestration = 46,700 tonnes • Building energy reduction = 41,200 MWH • Avoided carbon emissions = 17,000 tonnes • Air pollution removed = 1,680 metric tonnes Hydrology • i-Tree Hydro shows reduction in stream flow rates with increased forest cover • % impervious cover has more significant effects
Benefits of i-Tree Eco Study for Toronto Urban Forestry • Provides baseline information and a monitoring framework to inform management of the urban forest. • Results support current program direction & priorities. • Confirms that 60% of the urban forest is on private property - supports rationale for new policy/programs. • Provides an important information platform to continue engaging other operating divisions, Council and the public.
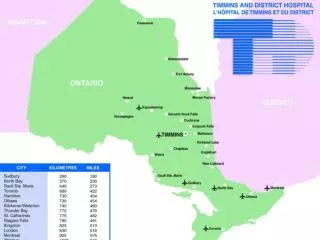
Study Elements • Peel and York Regions • i-Tree Eco • Digital Land Cover Map • Priority Planting Index • Grow-out Scenarios • i-Tree Hydro • Ajax and Pickering • i-Tree Eco • Aerial photo interpretation
85 215 214 200 224 217 199 207
Canopy Cover and Leaf Area Table 1: Canopy cover and leaf area metrics for study areas
Urban Forest Distribution • Text • Etc Figure 1: Existing and possible tree canopy in Peel study areas summarized by service delivery areas (SDA)
Priority Planting Index • Summarized by small geographic unit (SGU) • Prioritize areas of high population density and low canopy cover • Equitable distribution of ecosystem services Figure 2: Priority planting index in Mississauga summarized by small geographic unit
Distribution by Land Use Figure 3: Existing and possible tree canopy in Peel study areas summarized by land use
Species Composition - Mississauga Figure 4: Dominant tree species in Mississauga by percent of total leaf area and total number of stems • 10 most common species account for 57% percent of all trees • 56 % of species are native to Ontario • 58 % of all trees are planted
Species Composition - Brampton Figure 5: Dominant tree species in Brampton by percent of total leaf area and total number of stems • 10 most common species account for 72% percent of all trees • 43 % of species are native to Ontario • 20 % of all trees are planted
Tree Size Figure 6: Diameter class distribution of trees in Peel study areas In Brampton a tree that is 65 cm in diameter stores 10 times more carbon and 75 times more pollution than a tree that is 11 cm in diameter
Air Pollution Removal Annual Removal Value: Mississauga: $4.8 million Brampton: $3.2 million Bolton: $110,000 Annual sulfur dioxide removal in Mississauga = Annual sulfur dioxide emissions from 19,100 automobiles Annual PM10 removal in Brampton = Annual PM10 emissions from 170,700 automobiles Figure 7: Annual air pollution removal by trees in Peel study areas
Climate Change Mitigation • Carbon storage = 405,000 tonnes or $11.5 million • Annual carbon sequestration = 19,050 tonnes or $ 544,000 • Annual residential energy savings = $2.4 million • Annual carbon emissions avoided = 4,300 tonnes or $128,000 Carbon stored in Mississauga = annual carbon emissions from 167,400 single family homes Carbon stored in Brampton = annual carbon emissions from 116,000 automobiles
Next Steps • Urban Forest Strategies and Management Plans • Educate and engage • Protect • Maintain • Plant • Monitoring and Research • Repeat at 10 year intervals • Evaluate trends • Anticipate future challenges • Pursue partnerships • Regional Study • Municipal comparisons • Encourage provincial support
Acknowledgments Andy Kenney
Rike Burkhardt City of Toronto Urban Forestry Meaghan Eastwood Toronto and Region Conservation Authority Ecology Division