Download
1 / 13
150 likes | 352 Views
NITROGEN MOLECULAR SPECTRA OF AIR FLUORESCENCE EMULATOR USING A LN 2 COOLED CCD. NTUA. VILLA OLMO. S. Maltezos, E. Fokitis, V. Gika, P. Fetfatzis, G. Koutelieris and E. Galanis. Physics Department, National Technical University of Athens. Outline. The Air Fluorescence Yield in UHECRs

E N D
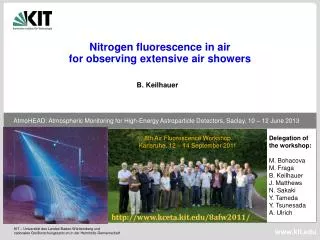
NITROGEN MOLECULAR SPECTRA OF AIR FLUORESCENCE EMULATOR USING A LN2 COOLED CCD NTUA VILLA OLMO S. Maltezos, E. Fokitis, V. Gika, P. Fetfatzis, G. Koutelieris and E. Galanis Physics Department, National Technical University of Athens 11th ICATPP, Como, Italy S. Maltezos
Outline • The Air Fluorescence Yield in UHECRs • Emulator Setup of the Nitrogen Fluorescence • Noise Tests of a LN2 Cooled CCD • Nitrogen Molecular Spectra • Conclusions and Prospects 11th ICATPP, Como, Italy S. Maltezos
Fluorescence radiation • During an EAS event: the produced secondary charged particles (electromagnetic component) ionize or excite the atmospheric air molecules producing fluorescence radiation after their de-excitation (N2 and N2+). • The total energy of the emitted radiation of air fluorescence during the EAS event is about 90 % of the energy of the UHECR primary particle • The main source of the experimental uncertainty of the energy determination of the primary particle comes from our limited accuracy in the air fluorescence yield Τhe motivation for our recent efforts and also for this work, comes from relevant results of experimental and theoretical studies for the determination of air fluorescence yield. 11th ICATPP, Como, Italy S. Maltezos
Air fluorescence yield The number of photons (mostly in UV range) detected by a fluorescence telescope is proportional to the deposited energy of ionizing particles inside the field of view at atmospheric depth X, is given by the integral: Where, t denotes the transmittance of the atmosphere, eDthe efficiency of the detector and Y the fluorescence Yield which depends on the wavelength, temperature and pressure. An emulator setup we present below gave us the possibility to develop a high resolution and high sensitivity UV spectrograph which should be appropriate to record the air fluorescence in electron beam accelerators. The spectrum of the molecular spectrum is composed of several band heads of the 2P(v‘,v“) - second positive) and 1N(v‘,v“) - first negative band systems of N2 and N2+ respectively. 11th ICATPP, Como, Italy S. Maltezos
3 4 2 1 LN2 cooled CCD assembly The high-vacuum pumping system for the CCD cryogenic chamber The CCD, type CCD30-11 (AIMO) from E2V has 1024x256 26 mm square pixels. The read noise is 6 e- rms (equivalence: 7.63 e-/ch) A Xcam CCD40-11 used for set-up purposes, and window fitted Internal chamber (1) with Xcam CCD40-11 attached (in final setup the CCD30-11 was installed) A Vacuum of about 2x10⁻⁵ mbar (3) has been achieved using a turbo-pump operating at 28000 RPM (2) and a LN2 trap (4). This procedure lasts typically 3 days. Exploded assembly 11th ICATPP, Como, Italy S. Maltezos
3 5 2 6 4 1 Emulator Setup: lamp & spectrograph Τhe source of the emulator setup is a spectral lamp filled with low pressure atmospheric air made by Meltz Electrolamps Moscow. In the CCD windows one or more spectral lines can be recorded at the same time with a resolution dl=0.04 nm. Initial setup using a thermoelectrically cooled CCD from SBIG Modified setup with a LN2 cooled CCD from E2V and electronics/cryogenics from XCAM 11th ICATPP, Como, Italy S. Maltezos
Emulator setup: CCD moving mechanism The CCD can move along a pre-defined focal curve (in plane) achieving the optimal position at each spectral window (~5 nm for the SBIG CCD and ~ 15 nm for the E2V CCD) Ai is the possible grating position while O is the center of curvature of the spherical mirror. This study is very accurate for small active area of the optical grating improving the resolution at the same time. It can be shown by geometrical analysis that the position vector of the focal curve is given by: where, R is the mirror radius and d is the distance between curvature center and grating. 11th ICATPP, Como, Italy S. Maltezos
Read noise tests of the LN2 cooled CCD Noise distribution with exposure time 1 s. Lamp HV power supply “on”. Read noise (sigma): NR=39 channels Noise distribution with with exposure time 1 s. Lamp HV power supply “off”. Read noise (sigma): NR=13 channels 11th ICATPP, Como, Italy S. Maltezos
Expected signal to noise ratio The signal-to-noise ratio is a crucial index of merit for the molecular spectrum recording at the electron beam accelarators environment Where,Is is the signal current, Id (as a function of operation temperature) is the dark current, Nr is the read noise and t is the exposure (integration) time. • The improvement of the dark signal during cooling is limited by the read noise and this is reached around -83 oC (190 K). • Operating at this temperature range, a signal-to-noise ratio around 20 for 1 h exposure time per vertical strip 222 mm wide and 6656 mm height (it covers the whole structure of the line) in a typical accelerator beam such of the AIRFLY experiment could be achieved. 11th ICATPP, Como, Italy S. Maltezos
The air fluorescence spectrum A typical low resolution air fluorescence spectrum (recorded by AIRFLY) S. W. for E2V CCD Dl=15 nm S. W. for SBIG CCD Dl=5 nm In our emulator setup we can record the spectral lines in 10 pre-selected spectral windows-positions. 11th ICATPP, Como, Italy S. Maltezos
391.44 nm 391.44 nm Nitrogen molecular spectra Two successive pictures of the line 391.44 nm of 1N system obtained with E2V CCD at -124 oC and 300 s exposure time. The diagram below is produced by integration of the pixel channels (counts) along the y-axis. The weak line at 394 nm is just visible covered by the total noise. 391.44 nm 11th ICATPP, Como, Italy S. Maltezos
Nitrogen molecular spectra Two previous plots with zoom in narrower spectral window. The external noise is superimposed to the signal, nevertheless the rotational spectrum (lines from R and P branches) with Boltzmann envelop is not hard to identify. 11th ICATPP, Como, Italy S. Maltezos
Conclusions and Prospects • We investigated the possibility to maximize the sensitivity of a emulator setup for the air fluorescence study using a CCD sensor cooled at LN2 temperature range. • The emulator setup has been tested in conjunction with the 1 m focal length UV Spectrograph in a modified configuration. • The tests, by means of recording the nitrogen molecular spectral transitions, were very promising apart the external electronic noise. • In our future plans is to improve the mechanical support of the cryogenic chamber/CCD and also fixing the problem of the external noise. A new set of measurements at very low light levels has to be scheduled for studying the detection limits will be obtained. 11th ICATPP, Como, Italy S. Maltezos