Download
1 / 56
560 likes | 974 Views
Global change. Natural short and long term changes Anthropogenic changes. Natural cycles. Glacial cycles Holocene climate variability Orbital cycles Milankovitch cycles – regular shifts in earth’s climate. Glacial-interglacial. Relationship between glacial-interglacial cycles and CO 2

E N D
Global change Natural short and long term changes Anthropogenic changes
Natural cycles • Glacial cycles • Holocene climate variability • Orbital cycles • Milankovitch cycles – regular shifts in earth’s climate
Glacial-interglacial • Relationship between glacial-interglacial cycles and CO2 • During glacial periods, older avg global temp (5-6 oC), lower sea level (~100 m), change in ocean circulation • Causes • Changes in Earth’s orbit around the sun – also cause seasons • Gravitational attraction between Earth and other bodies interact with orbital factors • Tilt (obliquity) – changes solar lumination input (41 ky periodicity) result in seasonality; earth’s spin axis is tilted • Eccentricity – the degree to which the Earth’s orbit is elliptical (100 ky periodicity); affects seasonality in N hemisphere; affects annual average solar input • Precession of spin axis – spin axis moves do to gravitational forces between bodies (wobble) • Interaction effects between tilt and eccentricity (positive or negative interaction) • All lead to differences in solar input
Figure 14.21 Geometry of the Earth's orbit and axial tilt. A. Precession. The Earth wobbles on its axis like a spinning top, making one revolution every 26,000 years. The axis of the Earth's elliptical orbit also rotates, though more slowly, in the opposite direction. These motions together cause a progressive shift, or precession, of the spring and autumn equinoxes, with each cycle lasting about 23,000 years. B. Tilt. The tilt of the Earth's axis, which now is about 23.5 degrees, ranges from 21.5 to 24.5 degrees. Each cycle lasts about 41,000 years. Increasing the tilt means a greater difference, for each hemisphere, between the amount of solar radiation received in summer and that received in winter. C. Eccentricity. The Earth's orbit is an ellipse with the Sun at one focus. Over 100,000 years, the shape of the orbit changes from almost circular (low eccentricity) to more elliptical (high eccentricity). The higher the eccentricity, the greater the seasonal variation in radiation received at any point on the Earth's surface.
(but NH is tilted toward from the sun) (but NH is tilted away from the sun) Making N hemisphere winters milder.
Today, tilt and eccentricity (+precession) oppose one another in the N Hemisphere Today tilt and eccentricity (+precession) reinforce one another in the S Hemisphere
Frequency and amplitude of variability Not equally scaled
Astronimical theory of ice ages • Changes in seasonal contrasts over geological time • Due to 3 dominant factors – precession (wobble), tilt (obliquity), and eccentricity (shape of earth’s orbit around the sun) • Driver of ice ages is Milankovitch cycles • Exact causes not well-understood • Needed some major change to initiate cycles • India colliding with Asia (increased weathering)? • Initial cooling due to plate tectonics slowing down? • Feedback loops likely important
Pleistocene glaciations • Pleistocene glaciation (~ 1mybp) – start of quaternary • Why did they start? Some perturbation? • Ice-albedo feedbacks – positive • What kept them going, but what reversed them? • Timing of glacial cycles – • Initially glacials and interglacials equal in length (40-50 ky cycles) • Increase in length of glacials more recently, why?
Frequency of glaciations increasing
Decrease in spreading rates also decreases subduction Disturbance to carbonate-silicate cycle via decreased seafloor spreading rates
Fig. 8-17 Collision of India with Asia. increase in weathering Continental collision creating monsoonal climate with lots of rain and weathering? http://www.moraymo.us/uplift_overview.php
Lots of Buts…. • Eccentricity cycle (100 ky) is weakest of 3 cycles but sets frequency of glacial cycles? • Rate of change during glacial transitions is rapid relative to astronomical changes? • N vs. S hemisphere have same schedules for glaciation but should they? • Ice core data from both hemisphere similar
Role of the oceans? • Deep water circulation altered or shut off during glacials • CO2 changes – cause or effect/positive feedback? Unlikely that CO2 itself triggered glacial/interglacial transitions
Implications • Global climates and greenhouse gases change over glacial/interglacial timescales • Also shorter timescales – Heinrich events (due to FW inputs and feedback from ocean circulation) and Dansgaard-Oeschgerevents (rapid warming in N hemisphere) within glacial cycles • Due to reorganization of ocean-atm system (multiple steady states? Glacial and interglacial?) • Will there be a third, warmer quasi-stable state
Fig. 3 During a Heinrich event, icebergs surge into the North Atlantic Ocean. The lower panel illustrates the entrainment of debris (black) by icebergs and the subsequent sedimentation of the debris in the deep North Atlantic.
Holocene climate variability • Short-term variability • 1-2 ky sub-Milankovitch periodicity • Other cycles • Important to understanding natural variability versus anthropogenic • After last ice age • Medieval warm period (imp for Europe), Little Ice age (Greenland)
Causes • Astronomical • Early anthropogenic hypothesis – human’s staved off next glacial; greenhouse gases behaved differently in initial stages of this interglacial • Episodic factors – changes in solar activity, tectonic activity • Changes in ocean circulation – FW inputs • Changes in sunspot activity • Volcanic activity
Little Ice Age Medieval Warm Period Holocene climate optimum • maximum seasonal contrast • tilt and eccentricity reinforce another • CO2 at a max. • - “start of interglacial’ LGM Younger Dryas - Sudden cooling Fig. 14-1 (Ruddiman)
Sunspot activity Correlation = Causality (?)
High sunspot activity Wolf Minimum (1282-1342) Low sunspot activity Maunder Minimum (1645-1715) Low sunspot activity Spörer Minimum (1450-1534) Low sunspot activity
Cooling due to volcanic eruption: The global mean temperature changes for 5 years preceding and following a large volcanic eruption (at year zero). The temperatures are the average changes noted for five major eruptions: Krakatau, August 1883; Santa Maria, October 1902; Katmai, June 1919; Agung, March 1963; and El Chichón, April 1982. The effects of ENSO on temperatures have been removed. (After A. Robock and J. Mao, 1995. The Volcanic Signal in Surface Temperature Observations. Journal of Climate, 8:1086–1103.) Fig. 15-6
Present day • ENSO events • Sea ice atm-ocean interactions at high latitudes
Eruption of Mt. Tambora (1815) Low volcanic activity High volcanic activity
Timing and amplitude of forcing Stochastic resonance – superimpose random forcing on low amplitude periodic forcing
Global warming • Recent climate change • What controls climate and what’s changed? • Present day forcings • Changes in solar input (luminosity) • Changes in albedo (volcanoes, land cover, ice) • Changes in greenhouse gases • Changes in feedbacks • Planetary forcings • Stochastic events • Humans – the new element • Can’t explain current T trends without it – radiative forcing (changes in balance of incoming and outgoing radiation) • Radiative forcing affected by: increases and decreases in solar input, planetary albedo, and concentrations of greenhouse gases
Archer - Fig. 11.8 (Hadley Centre results)
Albedo • Aerosols, clouds, ice/water/land distribution • Feedbacks between temp and changes in things affecting albedo • Aerosols – cooling effect (reflect incoming radiation) • Fine particles • Also form cloud condensing nuclei • Produced by natural (volcanoes) and unnatural (fossil fuel burning) processes • Relative albedos of ice/water/land • Ice (0.8) > deserts & unvegetated land (~0.5) > water & vegetated land (< 0.1)
Earth Surface Albedo Oceans - < ~0.1 Vegetation - < ~0.25 Non-vegetated land - ~0.5 Ice - ~0.8
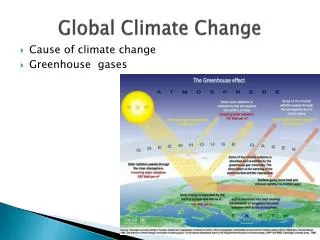
Greenhouse effect • Radiative balance • Temp controlled by balance between incoming solar flux, amount of outgoing IR radiated from Earth, redistribution of radiation before it is reradiated to space (e.g., outgoing IR retained by greenhouse gases) • Natural greenhouse • Unnatural greenhouse • CO2 – excursions greater than glacial/interglacial • Correlations with human activities (fossil fuel burning), ocean uptake, land use changes (deforestation) • Where does this stuff go? Oceans and atm • Effects on earth system (ecological, climatological, etc) • Other greenhouse gases • Same as above (S, methane, water vapor)
Uncertainties • Clouds • warming or cooling • Albedo versus greenhouse
Low albedo (rel. to low clouds) low temp. (low outgoing IR flux) Greenhouse effect dominates Fig. 3-18 The different effects of high and low clouds on the atmospheric radiation budget. High albedo and high sfc. temp. (large outgoing IR flux) Albedo effect dominates
Evidence of Climate Change Temperature records (ground thermometers, proxy records) Atmospheric temperature records Ocean warming Glacier melting Ecosystem changes Changes in the hydrologic cycle
IPCC Fourth Assessment Report (2007) Warming of the climate system is unequivocal, as is now evident from observations of increases in global average air and ocean temperatures, widespread melting of snow and ice, and rising global mean sea level. The IPCC also finds that it is “very likely” that emissions of heat-trapping gases from human activities have caused “most of the observed increase in globally averaged temperatures since the mid-20th century.”
IPCC History: Evolution of Our Knowledge • FAR (1990): “The size of the warming is broadly consistent with predictions of climate models, . . . but the unequivocal detection of the enhanced greenhouse effect from observations is not likely for a decade or more.” • SAR (1996): “The balance of evidence suggests a discernible human influence on climate.” • TAR (2001): “There is new and stronger evidence that most of the warming observed over the last 50 years is attributable to human activities.”
CO2 removal • Oceans • Atm accumulation • Reforestation • Problem of not understanding feedbacks or their direction – how far can the ocean go? How will changes in temperature affect the direction of changes, etc.
(Fig. 16-2) Fossil fuel reserves exhausted Long term projection Fig. 11.12
Projections equally depressing • Stabilizing total emissions or stabilizing rates of emissions • Models are simply C cycle models – what about everything else and their feedbacks? • Emissions – radiative forcing calculations are not linear