Download
1 / 15
150 likes | 251 Views
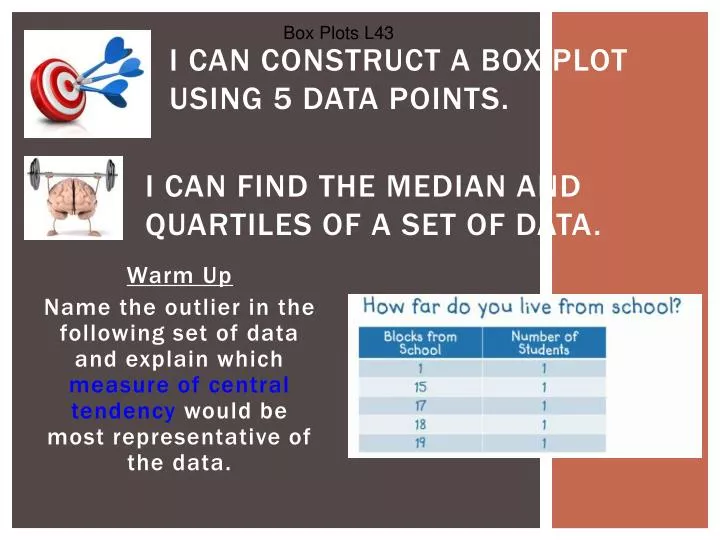
Box Plots L43. I can find the median and quartiles of a set of data. . I can construct a box plot using 5 data points. . Warm Up Name the outlier in the following set of data and explain which measure of central tendency would be most representative of the data. . BOX & WHISKER PLOT

E N D
Box Plots L43 I can find the median and quartiles of a set of data. I can construct a box plot using 5 data points. Warm Up Name the outlier in the following set of data and explain which measure of central tendency would be most representative of the data.
BOX & WHISKER PLOT Definition: A box-and-whisker plotis a diagram that shows the distribution of a set of data along a number line. The data is divided into 4 parts called quartiles. Each quartile represents 25%of the data.
NEW VOCABULARY • Median = • the middle of the data • Lower Quartile = • the middle of the lower half of data • Upper Quartile = • the middle of the upper half of data • Lower Extreme = • lowest number • Upper Extreme = • highest number
Introduction • A box-and-whisker plot can be useful for handling many data values. • They allow people to explore data and to draw informal conclusions when two or more variables are present. • It shows only certain statistics rather than all the data. • Box and whisker plots consists of the median, the quartiles, and the smallest and greatest values in the distribution.
How to make a Box and Whisker Plot Step 1: Order Data Put your data in increasing numerical order.Example:100, 27, 34, 54, 59, 18, 52, 61, 78, 68, 82, 87, 85, 93, 91 In order from least to greatest….18, 27, 34, 52, 54, 59, 61, 68, 78, 82, 85, 87, 91, 93, 100
Step 2 – Find the Median How to make a Box &Whisker Plot 18, 27, 34, 52, 54, 59, 61, 68, 78, 82, 85, 87, 91, 93, 100 *The median is the number in the middle of the data*
Step 3 – Lower Quartile How to make a Box &Whisker Plot Third, we only look at the data to the left of the median 18, 27, 34, 52, 54, 59, 61, 68, 78, 82, 85, 87, 91, 93, 100. We find the median of those numbers 18, 27, 34, 52, 54, 59, 61
How to make a Box &Whisker Plot Step 3 – Lower Quartile Do not include the median as a data point while finding the Lower Quartile Third, we only look at the data to the left of the median 18, 27, 34, 52, 54, 59, 61, 68, 78, 82, 85, 87, 91, 93, 100. We find the median of those numbers 18, 27, 34, 52, 54, 59, 61
If you have an even number of data points. Meaning that your first median (53 in this case) was the average of the two middle values, then you do include those numbers (52 and 54) while finding your Lower and Upper Quartile Step 3 – Lower Quartile How to make a Box &Whisker Plot Median = (52 + 54) / 2= 53 18, 27, 34, 52, 54, 59, 61, 68 We find the median of those numbers 18, 27, 34, 52, Different data on this slide for modeling purposes only Lower Quartile = (27 +34) / 2 = 30.5
Step 4 – Upper Quartile How to make a Box &Whisker Plot Next, we only look at the data to the right of the median 18, 27, 34, 52, 54, 59, 61, 68, 78, 82, 85, 87, 91, 93, 100. We find the median of those numbers 78, 82, 85, 87, 91, 93, 100.
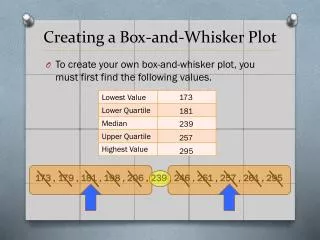
Step 5 – Highest/Lowest Values How to make a Box &Whisker Plot Circle your lowest and highest data points 18, 27, 34, 52, 54, 59, 61, 68, 78, 82, 85, 87, 91, 93, 100
Step 6 – Drawing Graph How to make a Box &Whisker Plot 18, 27, 34, 52, 54, 59, 61, 68, 78, 82, 85, 87, 91, 93, 100. Plot the lowest value, lower quartile, median, upper quartile, and the highest value on a number line.
How to make a Box &Whisker Plot Put a line through the Lower Quartile, Median, and Upper Quartile. Then Put a box around those lines Lastly draw a line from your extreme values to the box
How to make a Box &Whisker Plot There is your Box and Whisker Plot Q: Can you guess where the graph gets it’s name? Lower Extreme=18 Lower Quartile =52 Median= 68 Upper Quartile= 87 Upper Extreme= 100
Interquartile range= the difference between the upper quartile and the lower quartile How to make a Box &Whisker Plot Lower Extreme=18 Lower Quartile =52 Median= 68 Upper Quartile= 87 Upper Extreme= 100 87– 52 = 35= IR