Download
1 / 13
130 likes | 215 Views
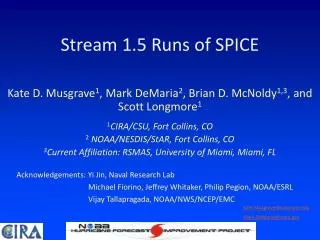
Objective Evaluation of 2010 HFIP Stream 1.5 Candidates. Louisa Nance, Christopher Williams, Michelle Harrold , Kathryn Newman, Paul Kucera , and Barb Brown National Center for Atmospheric Research (NCAR) Research Applications Laboratory (RAL) Joint Numerical Testbed (JNT )

E N D
Objective Evaluation of 2010 HFIP Stream 1.5 Candidates Louisa Nance, Christopher Williams, Michelle Harrold, Kathryn Newman, Paul Kucera, and Barb Brown National Center for Atmospheric Research (NCAR) Research Applications Laboratory (RAL) Joint Numerical Testbed (JNT) Tropical Cyclone Modeling Team (TCMT) Acknowledgements: National Hurricane Center – case selection and verification metrics HFIP Verification Team – verification metrics Participating Modeling Groups – retrospective forecasts
HFIP Stream 1.5 Concept • Stream 1: Yearly upgrades to operational numerical weather prediction capabilities • Stream 2: Enhancements to operations that require multiple year applied research, development and transition-to-operations work • Stream 1.5: Improved models (mainly) that the NHC, based on prior assessments, wants to access in real-time during a particular hurricane season, but which can’t be made available to the NHC by the operational modeling center in conventional “production” mode (typically due to limits in computing capability and/or programmer time)
2010 Stream 1.5Retrospective Cases Eastern Pacific: 2008 – 5 storms 2009 – 6 storms Atlantic: 2008 – 8 storms 2009 – 9 storms
Data Inventory % Expected Storms & time periods Planned basins & # of runs/day
Methodology Stream 1.5 Candidate Operational Baseline forecast forecast forecast forecast ……. ……. NHC Vx NHC Vx NHC Vx NHC Vx ……. ……. errors errors errors errors Track & Intensity (along- & cross- track too) ……. ……. matching – homogeneous sample pairwise differences error distribution properties median, mean, interquartile range, 95% CI, outliers Graphics SS tables Median ± 95%CI does not include zero
Error Distributions Absolute Intensity Error GFDL vs GFD5 Atlantic Basin Difference Distributions GFDL-GFD5 Atlantic Basin
Statistically Significant Differences GFDL Baseline Consensus Baseline Track Intensity
NHC’s 2010 Stream 1.5 Decision Accepted • GFD5 • Accepted prior to TCMT evaluation • AHW1 • Statistically significant improvementsat numerous time periods when added to the operational consensuswith no statistically significant degradations • Substantial improvements over the consensus at 96 and 120 h (not statistically significant) Note: Sample provided smaller than desired Not accepted • ARFS • Largely neutral impact on the consensus and limited sample size. • COTC • Not sufficiently strong or consistent enough to warrant inclusion Note: Provided a significant sample size
Sample Size ImpactFull COTC sample vs sample consistent w/AHW1 GFDL Baseline Consensus Baseline Track Intensity
Basin Sensitivity Atlantic Eastern Pacific
2011 Stream 1.5Retrospective Cases • Eastern Pacific: • 2009 – 6 storms • 2010 – 7 storms • Atlantic: • 2008 – 4 storms • 2009 – 7 storms • 2010 – 16 storms