Download

1 / 26
260 likes | 265 Views
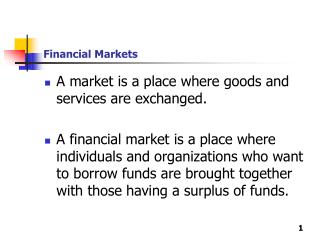
Antebellum Financial Markets. Development of Financial Markets and Institutions: 1790-1860. Financial Markets : For government, banks, insurance and “improvement” companies. Borrowers. Savers. Financial Institutions : banks and insurance companies. Returns. Flows.

E N D
Development of Financial Markets and Institutions: 1790-1860 Financial Markets: For government, banks, insurance and “improvement” companies Borrowers Savers Financial Institutions: banks and insurance companies Returns Flows
But is the U.S. One Market or Many?Market Integration • Information? • How is information transmitted in financial markets? • What is the definition of market integration? • Is integration a good thing?
Evidence of Antebellum Integration • Estimated bank loan rates. If these rates moved together, it indicates that even if banks were “isolated” and built on proprietary information, they were linked. • Actual Commercial paper rates. These were the biggest antebellum market (for large firms, good signatures). Banks and brokers were active trading commercial paper. This market was the crucial link between the regional banking markets.
Estimated Bank Loan Rates—all move together but most closely synchronized are the Northeast from Boston to Baltimore, centering on New York
Reaction---Bodenhorn (p. 589). • In September 1857, when interest rates in New York City rose to 24% and more in the early stages of the panic, the New Orleans Daily Picayune reported that local bankers and brokers had “little concern for the goings-on on Wall Street.” Panic a result of overtrading by New York banks and it will remain local. • No one in New Orleans felt that a widespread panic was imminent, and the 10% discount rate on prime commercial paper bore out that optimism. • Less than four weeks later, however, the panic had spread and interest rates in New Orleans reached 24 to 36%......The mood among merchants was “an overall feeling of depression.
Arbitrage • These were market with high transactions costs. The interest rates were sensitive but the costs of arbitrage were high. • When the NYC rate was 1.22% higher than the Philadelphia, then a New York correspondent could earn $1.22 on $100 sent to Philadelphia, but the cost was $2.37. • Arbitrage points created a wide band, allowing considerable fluctuation. • These markets provide for integration in the sense that they are linked to some so degree. • Flows between the regions relatively modest with a very limited set of short-term negotiable financial instruments. • Were these markets efficient markets?
An efficient market? An efficient market is where prices reflect the use of all relevant available information by market participants • Markets appear to be integrated but were they efficient? Did they reflect the use of all relevant information? • If they were efficient, then time series of differences should be stationary—all information should be absorbed. Series should not follow a random walk but should be “stationary” • dt = dt-1 + et where E[et ] = 0 • Random walk would imply that differentials in one period carry over to the next so that arbitrager can profit from transfer of funds after the information has been transmitted.
Null hypothesis of a unit root in the differentials is rejected at the 5% level in all cases---thus markets efficient in that regional differentials dissipated quickly and there were but few temporary arbitrage opportunities. Interest rates stationary—they stay linked together and do not drift apart. Differences fluctuate around zero within the arbitrage points
Antebellum (1840-1860) markets were integrated! • In an exhaustive study of the antebellum period, Bodenhorn (2000) found that interest rates in most regions varied around the rate for New York City---the emerging financial center. Antebellum short-term credit market encompassed the whole Northeast and worked to equalize short-term interest rates. But, less so the Old South or South Atlantic states. • Before 1840? Did the Second Bank of the United States integrate the markets? Was there a problem after the Bank Veto? The panic of 1837?
Role of the Civil War • War disrupted the established financial links between the North and the South • Huge destruction of Southern economy including banks that had invested in Confederate bonds---go bankrupt. Very slow reappearance of banking abetted by impoverishment of the South. • Antebellum markets were linked because loans were to cotton factors not planters who required loans and mortgages. Rise of sharecropping---smaller and more risky producers. • Opening up of West where higher regional risks.
Integration of Securities Markets: The Role of Technology • How long does it take you to find the best price and buy it? • Garbade and Silber (1978): • (1) Domestic telegraph effects in 1840s, • (2) Transatlantic Cable 1866 • (3) Consolidated Stock market ticker 1975. • Accelerate search and order execution • More efficient arbitrage and reducing inter-market price differentialsincreased market integration.
Gains in Time • Before New York-Philadelphia telegraph (1846), information took one day or more to travel, Afterwards a day or less. Telegraph NY-New Orleans (1848). • Before 1866, three week time delay for information between New York and London markets for American debt. Afterwards a one day delay. • Before 1975 Consolidate Tape, Price of a trade on a regional exchange took 5 to 10 minutes to reach New York. Afterwards, delay one or two minutes.
Welfare Gains from Change? • Faster communication equalizes securities prices faster. • Gains to investors—”find best price faster”—reduces search time. • Gains also to real sector---easier to adjust investment. • More people willing to enter the market and this increases liquidity
Garbade and Silber • Examine price differential before and after the introduction of the telegraph on • bills of exchange • common stock • state and federal bonds • Compute mean absolute difference (MAD) of contemporaneous prices for many days. • Compute standard deviation of the absolute difference about the mean absolute difference (SDAD)
What are the units? What are the differences? Significantly different at what level?
Minutes of time difference NYSE and Midwest Exchange • Significant at the 5% level?
Garbade and Silber • How economically important were these three innovations? • Domestic and Trans-Atlantic Telegraph led to significant and rapid narrowing on inter-market price differentials. Little evidence for Consolidated Tape. • First two not only speeded up information dissemination but also execution of orders.