Download
1 / 20
200 likes | 276 Views
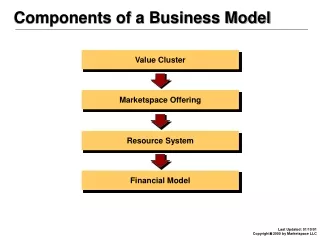
9. Analyzing the Cost of a Business Model. Cost Drivers (1 of 4). Defined: The basic factors that determine costs. The factors associated with the firm’s resources, activities, positions, and industry that have a causal effect on the business model’s costs. Cost Drivers (2 of 4).

E N D
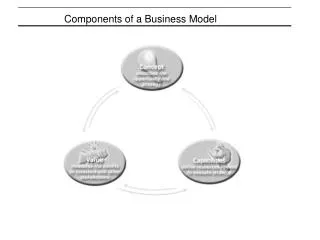
9 Analyzing the Cost of a Business Model
Cost Drivers (1 of 4) Defined: The basic factors that determine costs. The factors associated with the firm’s resources, activities, positions, and industry that have a causal effect on the business model’s costs.
Cost Drivers (2 of 4) • Industry Drivers • Competitive Environment • Cooperative Environment • Macro Environment • Resource Drivers • Quality • Quantity • Rate
Cost Drivers (3 of 4) • Activity Drivers • Which • How • When • Position Drivers • Customer Value • Strength of Position • Price
Measuring Costs By measuring costs, a firm can pinpoint where costs are lowest or highest and then it can determine why they are low or high by backtracking to the cost drivers.
Financial Statements (1 of 4) Terms defined: 1. Cost of Goods Sold – total cost (direct and indirect) directly attributable to products whose manufacturing was completed during the period 2. Gross Margin (gross profit) – difference between revenues and costs of good sold 3. Selling and General Administrative Expenses – costs associated with the marketing and selling of the goods and with the general administration of the company 4. Operating Income – difference between gross margin and selling and general administrative expenses 5. Interest Expense – interest paid on the debts of the firm
Table 9.1 Income Statement of Microchip Technologies, Inc. (2 of 4) Amount ($) Lines 1 Revenues 430,000 2 Cost of goods sold: 3 Beginning finished goods inventory, Jan. 1, 2002 100,000 4 Cost of goods produced 200,000 5 Cost of goods available for sale 300,000 3 + 4 6 Ending finished goods inventory, Dec. 31, 2002 30,000 7 Total cost of goods sold 270,000 5 - 6 8 Gross margin (gross profit) 150,000 1 - 7 9 Selling and general administrative expenses 100,000 10 Operating income 60,000 8 - 9 11 Interest expenses 28,000 12 Income before Taxes 32,000 10 - 11 13 Taxes 1,000 14 Net income 31,000 12 - 13
Financial Statements (3 of 4) • Activity-Based Cost Measurements • Frequency of Activities • Duration of Activities • Complexity of Activities
Figure 9.2Conversion of Resource Costs into Activity Costs and into Product Costs (4 of 4)
Tracking the Sources ofCost Differences (1 of 6) Identifying the sources of cost disadvantage or advantage: 1. Identify the activities of the business model’s business system—value chain, value network, or value shop. 2. Determine what drives the cost of each activity, and see if there is anything that can be done to improve the cost of the activity.
Tracking the Sources ofCost Differences (2 of 6) • Research and Development (from Table 9.2) • Industry Drivers: R&D spending depends on whether a firm is in the Wintel or Apple PC consortium. R&D spending in the Wintel camp is lower than that in the Apple camp and also depends on suppliers and complementors that have bargaining power. • Position, Activity, and Resource Drivers: It costs more to be a differentiator like Apple. Firms that choose to join the Wintel camp spend less on R&D. Emphasizing resources at the right points helps.
Tracking the Sources ofCost Differences (3 of 6) • Product Design (from Table 9.2) • Industry Drivers Sophistication and cost of designs depend on the camp a firm belongs to (Wintel or Apple) and on powerful suppliers of microprocessors and software. • Position, Activity, and Resource Drivers Some business customers may require special features that can drive up costs. Cooperation with Wintel partners to release products on time keeps the cost of early product introduction low.
Tracking the Sources ofCost Differences (4 of 6) • Manufacturing and Operations (from Table 9.2) • Industry Drivers The rapid rate of change of the industry’s technology, rapid drop in prices, and powerful suppliers of microprocessors and software mean inventory carrying costs can be a very high cost of manufacturing. • Position, Activity, and Resource Drivers Location. Management of component inventory. Build to order more critical to keeping costs low.
Tracking the Sources ofCost Differences (5 of 6) • Marketing and Sales (from Table 9.2) • Industry Drivers Installed base decreases cost of advertising. • Position, Activity, and Resource Drivers The commodity nature of the product suggests that PC firms may end up having to advertise more. Coopetitors in Wintel camp also advertise.
Tracking the Sources ofCost Differences (6 of 6) • Distribution (from Table 9.2) • Industry Drivers The rapid change in technology and rapid drop in prices make it costly going through dealers. Customers are sophisticated enough to bypass dealers and go straight to manufacturers. The Internet helps reduce the cost of distribution • Position, Activity, and Resource Drivers Bypass Distribution
Profits = revenues - variable costs - fixed costs = PQ - VCQ - FC = ( P - VC )Q – FC = contribution margin – FC = (contribution margin per unit)Q - FC Role of Fixed Costs and Demand (1 of 3)
Role of Fixed Costs and Demand (2 of 3) • Break-Even Analysis – the quantity at which revenues equal total costs The point where the firm has zero profits: From this Since P – Vc = the contribution margin per unit
Role of Fixed Costs and Demand (3 of 3) • Sunk Costs and Competitive Position: The costs of an asset that have already been incurred and cannot be recovered. • Barriers to Entry • Rivalry • Investing in Technological Change
Analyzing the Cost of a Business Model ? Questions