Download
1 / 50
500 likes | 668 Views
Food Price Review. Presentation outline. Background on NAMC’s role in food price monitoring International Trends Local Trends Long term trends (CPIX & CPI Food) Short term Factor impacting on food prices locally Short-term outlook. Background. NAMC’s involvement in food price monitoring.

E N D
Presentation outline • Background on NAMC’s role in food price monitoring • International Trends • Local Trends • Long term trends (CPIX & CPI Food) • Short term • Factor impacting on food prices locally • Short-term outlook
NAMC’s involvement in food price monitoring • Food price crisis of 2002 • Minister of agriculture appointed a Committee (FPMC) – to present a report by end of 2003 • FPMC findings: • No “foul play” behind price rises • Main factors: exchange rate, prices of raw materials • FPMC recommendations: • NAMC should implement a system of food price monitoring – to help DoA, etc. make informed policy decisions/interventions
Implementation of FPMC recommendations • NAMC set up a system of food price monitoring to track and report on food price trends in South Africa ; and • To provide explanations on the observed trends and advise DoA on possible actions • Urban Food Price Monitoring: • From 2004, retail food price data from urban areas was sourced from AC Nielsen (basket of 75 food items) • From this data, since 2004: • 1 Annual Food Cost Review per year • 4 Quarterly Price Trends reports per year
Implementation of FPMC recommendations • Rural Food Price Monitoring • In November 2006, collection in the rural areas commenced • Data collected by provincial department of agriculture (PDA) officials from all nine provinces
Implementation of FPMC recommendations • Scope Rural Food Price Monitoring
Implementation of FPMC recommendations • Training Rural Food Price Monitoring – Price collection procedures • Two national training sessions • Several training visits to provinces (see Table below)
Ongoing Developments • Developing good working relations with Statistics SA to ensure consistent data releases to the public • NAMC staff seconded to Statistics SA • NAMC regularly assist Statistics SA with selected tasks • Implementation of Input Cost Monitor • Provides a view of the other side of the value chain • To date Grain and Fruit Input Cost Monitor reports were published
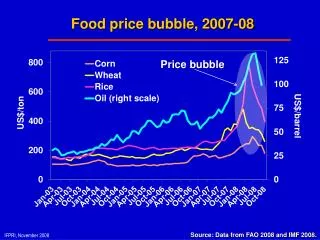
Wall Street Journal – Higher Food Prices to Hit Europe • “The global rise in food prices is catching up with continental Europe, adding to mounting inflation worries… Rising global food demand, freakish weather and the trend to reroute crops for biofuels are pushing up food-commodity prices globally” • Standard & Poor's GSCI Excess Return Index, which measures the price movements of eight agriculture commodities -- including wheat, sugar and corn -- is up 10% in the past year. • China Daily - Price rises take a toll in Shanghai • “The average price of pork at the city’s markets has increased 25 percent…” • “Prices of fish and chicken have also increased 10 to 15 percent from the year before.”
China (continue) • Consumer prices for food were up 15.4 percent in July from a year ago (International Herald Tribune) • Financial Post – Get ready for food-price spike • The U.S. producer price index for raw food and feedstuffs was up 19% or more year-over-year from February to June • topping 30% in May for the first time since 1974. • The Economist Intelligence Unit forecast the price of grains and oilseeds will rise 16% and 29%, respectively, this year.
Reasons for international trends • Global shortage of grains (low stocks, drought in major producing areas, high input costs and biofuels) • Changing diets, particularly of Chinese and Indians • E.g. the number of urban Chinese households qualifying as middle class rose to 42 million in 2005 from 7.6 million in 1995 • Will hit 199 million in 2015 (McKinsey Quarterly) • Global meat and milk consumption is up more than 3% and 2%, respectively, on average over the past three years. (USDA) • More affluent consumers in developing countries • Diseases in livestock
Relationship between food price inflation in rural and urban areas
CPI Food for rural and metropolitan areas: January 2002 – December 2006
CPI grains products for rural and metropolitan areas: January 2002 – December 2006
CPI dairy and eggs products for rural and metropolitan areas: January 2002 – December 2006
CPI vegetable for rural and metropolitan areas: January 2002 – December 2006
Products monitored by NAMC • Basket of 75 products from urban areas (since 2004) • Since November 2006, food price monitoring in rural areas commenced • 26 food products • 180 rural outlets throughout all 9 provinces
Latest NAMC food price trends(July 2006 – July 2007) • Retail food prices increased by 13.76% on average
Latest NAMC urban food price trends(July 2006 – July 2007) • Some items whose prices decreased (urban): • Eggs (-4.14%) • Tomatoes (-4.47%) • Hubbard squash (-9.95%) • Bananas (-20.23%) • (due to normal seasonal fluctuations)
Latest NAMC rural food price trends(Jan 2007 – July 2007) • Prices observed for only 16 products (some with two or more sizes)
Latest NAMC rural food price trends(Jan 2007 – July 2007) • Some decreases in the rural areas: • Margarine 125g (-1.70%) • Beans 410g (-0.86%) • Sugar 2.5kg (-0.34%) • Rice 2kg (-9.28%)
[1] Super and special maize meals prices are averaged Urban-rural comparison
Different factors • Price movements internationally • International agricultural policies • Monetary policy • Demand factors
Price movements: Maize CIF costs must still be added to CBOT price
Agricultural policies Source: OECD database 2005
Monetary policy • A long-run relationship between South African agricultural and industrial prices, the exchange rate and money supply. • This implies that changes to macroeconomic variables find their way into the agricultural sector. • Agricultural prices adjust faster than industrial prices to innovations in money supply • Agricultural prices overshoot their long-run values in the short run. • When monetary shock occurs then: • Increased volatility and uncertainty in prices
Monetary policy Source: SARB, 2007
Demand side • Increasing population • Impact of immigration and not knowing how many additional people are in the country • Increasing incomes • Including basic income grants • Changing consumer pattern • Healthier lifestyles
Looking ahead in the short-term • Maize & wheat prices expected to remain high leading to high maize meal & bread prices • Beef & lamb prices expected to remain high • Dairy products are expected to remain relatively high
Wheat to Bread Value Chain • NAMC under the instruction of the Minister of agriculture established a Section 7 committee to investigate the Wheat-to-Bread Value Chain and develop a turn-around strategy for the industry • Work plan • Section 7 committee already established • Review of recent and current research reports on the Wheat-to-Bread Value Chain • Request stakeholders at different levels of the chain to make formal submissions to the Section 7 Committee • Review submissions and request further clarifications/supporting information from chain • Submit recommendations to Minister of Land and Agriculture by end of March 2008
Retail Market Power-Dairy Industry • Dairy investigation • The impact of market power and dominance of supermarkets on agricultural producers in South Africa • Preliminary results • Points out conduct by retailers that could have negative long term impacts on the agricultural and food industry. • Retailers avoid price increases through various techniques and procedures and do have the ability to smooth out price changes and ensure gradual increases over time. • This might be beneficial to the consumer but there is now enough evidence that this is done at the cost of suppliers. • This ultimately could have long term negative effects for society as a whole in the form of greater concentration of suppliers and potential shortage of food supplies. • Similar findings in UK. • The report will form part of NAMC submission to the competition commission.
What can we do • Supply side constraints to increase farmers confidence : • Land reform beneficiaries are faced with big challenges, for example • Land right issues complicate their access to finance and credit • Skills and knowledge transfer (tacit knowledge and core competencies) • Technology transfer • Extension support • Inadequate or complete lack of infrastructure • Unaligned institutional support, etc • Investment in research, infrastructure and new production areas • Address high input costs challenges
What can we do • Demand side constraints to increase farmers confidence : • Develop new markets that will encourage an increase in production • Provide a package of incentives that will allow smme to compete • Re-think the way we use tariffs
What is government doing? • Social grants transfers • Food security programmes • Zero-rating of certain food stuff (19)