Download
1 / 23
230 likes | 378 Views
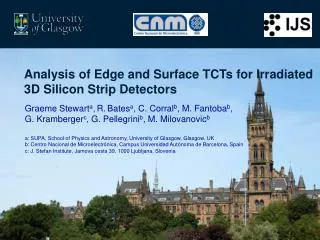
Preliminary Analysis of Edge and Top TCTs for Irradiated 3D Silicon Strip Detectors. Graeme Stewart a , R. Bates a , G. Pellegrini b , G. Kramberger c , M. Milovanovic c a: University of Glasgow, School of Physics and Astronomy, Kelvin Building, University Avenue, Glasgow, G12 8QQ

E N D
Preliminary Analysis of Edge and Top TCTs for Irradiated 3D Silicon Strip Detectors Graeme Stewarta,R.Batesa, G. Pellegrinib, G. Krambergerc, M. Milovanovicc a: University of Glasgow, School of Physics and Astronomy, Kelvin Building, University Avenue, Glasgow, G12 8QQ b: Centro Nacional de Microelectrónica, Campus Universidad Autónoma de Barcelona, Spain c: J. Stefan Institute, Jamova cesta 39, 1000 Ljubljana, Slovenia
Contents • Introduction • 3D Detectors • TCT Measurements • TCT Results • Non-Irradiated Top and Edge TCTs • Irradiated Top TCTs • Annealing Effects • Conclusions
Introduction • Radiation hard 3D detectors are a candidate for LHC upgrades. • Transient Current Techniques (TCTs) provide a method for investigating electric fields in silicon detectors. • In a TCT measurement, a short laser pulse is shone in a particular line through the detector. • Charge and current data is collected giving new information on the operation of 3D devices. • This can be repeated at many points across a detector’s surface to map the electric field.
Columns etched from opposite sides of substrate and don't pass through full thickness All fabrication done at CNM Distance between columns is 80 μm, with a 25 μm wide Aluminium strip connecting n-type columns. Substrate is 285 μm thick. 11 strips were bonded up but with readout only from the central strip. 3D Detector Design IR Photon
TCT setup Peltier controller The system is set in dry air atmosphere! Cooling to ~-20oC y table Cooled support Cu block Detector The whole system is completely computer controlled! 100 ps pulse 200 Hz repetition l=1064 nm cooling pipes x table z table 1 GHz oscilloscope detector HV Bias T Laser 2 fast current amplifiers (2.5 GHz) Laser driver trigger line G. Kramberger – 15th RD50 Meeting, 2009
Top TCT λ = 1064nm FWHM ~8 μm Edge TCT λ = 1064nm Top and Edge TCTs Advantages of TCTs: • Position of e-h generation can be controlled by moving tables • The amount of injected e-h pairs can be controlled by tuning the laser power • Easier mounting and handling • Not only charge but also induced current is measured – a lot more information is obtained
Top TCT λ = 1064nm FWHM ~8 μm Edge TCT λ = 1064nm Top and Edge TCTs Drawbacks of TCTs: • Applicable only for strip/pixel detectors if 1064 nm laser is used (light must penetrate guard ring region) • Only the position perpendicular to strips can be used due to widening of the beam! Beam is “tuned” for a particular strip • Light injection side has to be polished to have a good focus – depth resolution • It is not possible to study charge sharing due to illumination of all strips
Example Waveform Rise time of fastest peak can give velocity profile Reflection Integration of peaks gives charge collected Faster electron peak Slower hole peak
Non-readout n-type Electrodes p-type Electrodes Unit Cell Laser scans across surface Readout n-type Electrodes Non-Irradiated Top TCT Map is charge collected in 20 ns after laser pulse.
Non-Irradiated Top TCT 20V 20V
Full, under-column depletion at 40V 0V 3V 6V 9V 12V 15V Inter-column depletion at ~2V Non-Irradiated Top TCT
Laser scans across edge Non-Irradiated Edge TCT N-type Electrodes Waveforms collected at 20V P-type Electrodes
Non-Irradiated Edge TCT 0V 1V 2V 3V 4V 5V • Full depletion of inter-column region by 3V • Depletion of the region beneath the electron collecting n-type columns beginning by 4V • P-type columns not fully depleted by 6V 20V 6V
Irradiation and Annealing • Sample irradiated in Ljubljana facilities. • Irradiation fluence was 5x10¹⁵ 1MeV Nequ cm-2. • Sample always annealed in the setup with the Peltier element • constant laboratory temperature: 21 oC • stable position/laser • sample temperature stabilized to less than 1°C • Annealing at 60°C for a cumulative time of 600 minutes. • After each annealing step, voltage scans from 0V up to 400V were performed
60V 200V 400V 200V Irradiated Top TCT • Waveforms from the region between n-type columns show a double peak for electron and hole collection and a postive electron signal past 40 μm • Waveforms from the region across the p-type column show the same peaks without the bipolar signal
Resistance vs Annealing time, shown by C. Fleta at 15 RD50, June 2010. • Significant annealing beyond beneficial annealing leads to a decrease in the interstrip resistance. • Eventually, the strips short together. Annealing Effects • End of beneficial annealing at around 80 mins. • After type inversion we have a longer term reverse annealing
50V 100V 0V 150V 200V 250V 300V 350V 400V Annealing Effects – 20 mins 0V - 400V in steps of 50V
50V 100V 0V 150V 200V 250V 300V 350V 400V Annealing Effects – 40 mins 0V - 400V in steps of 50V
50V 100V 0V 150V 200V 250V 300V 350V 400V Annealing Effects – 100 mins 0V - 400V in steps of 50V
50V 100V 0V 150V 200V 250V 300V 350V 400V Annealing Effects – 300 mins 0V - 400V in steps of 50V
Annealing Effects – 600 mins 100V - 300V in steps of 100V 100V 200V 300V
Conclusions • Edge and top TCTs provide a new method to probe 3D devices. • Substantial depletion occurs at very low voltages. • Irradiation and subsequent annealing alters the collection of electrons and holes. Future Analysis: • Compare the velocity profiles of non-irradiated and irradiated detectors. • From the velocity profiles, electric field can be derived. • Edge TCTs of an irradiated sample, before and after annealing.