Download
1 / 36
650 likes | 1.96k Views
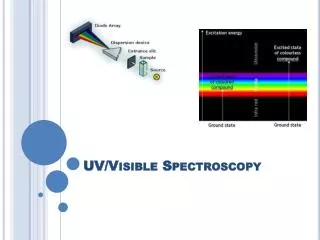
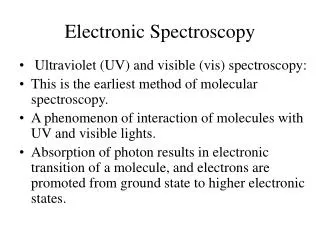
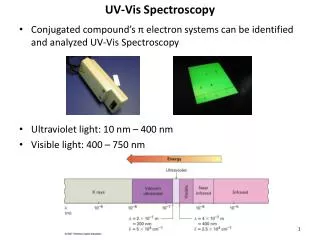
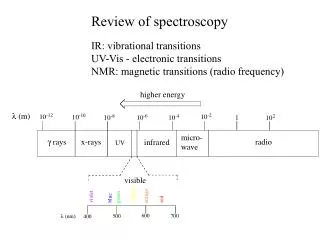
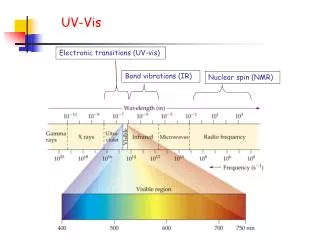
UV-Vis. Electronic transitions (UV-vis). Bond vibrations (IR). Nuclear spin (NMR). UV-Vis. When UV-Vis light is absorbed by a molecule a pi electron is moved to higher energy levels. *. *. . h . . . . .

E N D
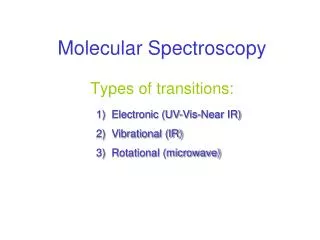
UV-Vis Electronic transitions (UV-vis) Bond vibrations (IR) Nuclear spin (NMR)
UV-Vis When UV-Vis light is absorbed by a molecule a pi electron is moved to higher energy levels. * * h This electronic transition is known as a pi to pi star (*) transition.
UV-Vis The lowest energy * orbital containing no electrons is called the Lowest Unoccupied Molecular Orbital - LUMO for short. The highest energy molecular orbital containing electrons is called the Highest Occupied Molecular Orbital - HOMO for short.
UV-Vis spectroscopy A * transition can therefore also be described as a HOMO LUMO transition. The wavelength of UV-Vis light absorbed by a compound is related to the energy difference between the HOMO and LUMO. Conjugation reduces the energy difference between the HOMO and LUMO, therefore more conjugated systems absorb light of longer wavelengths.
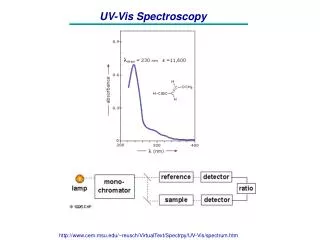
UV-Vis spectroscopy max is the wavelength at which a compound has maximun absorbance of light. max max B A
UV-Vis spectroscopy max is the wavelength at which a compound has maximun absorbance of light. max max B A
The value of max can be estimated using the Woodward-Fieser Rules • To estimate max values: • Identify the base structure to give a starting value. • Each conjugated C=C adds 30 - 40 to base value. • Each additional alkyl group adds 5 - 10.
Estimate the max values for the following: Generally you will find that maxis found by simply scanning the UV-Vis spectrum.
UV-Vis spectroscopy: Beer-Lambert law The main use of UV-Vis spectroscopy is in quantitative analysis. Beer-Lambert Law: A = lc Where A is absorption and is equal to the log(Io/I) where I is the intensity of light. = extinction coefficient or molar absorptivity c = concentration l = path length through the cell in cm (usually 1 cm) For a given compound being measured in the same instrument, l is constant. Thus, the relationship between A and c is linear.
UV-Vis spectroscopy: Beer-Lambert law Quantitative UV-Vis analysis is done at max of a compound to obtain maximum sensitivity, stability and reproducibility. The value of max is determined using a scanning UV-Vis spectrophotometer. Once max is known an adsorption vs concentration curve is generated. The Beer-Lambert Law: A = lc tell us that the relationship between adsorption and concentration is linear. The concentration of the compound in a sample is determined by measuring the adsorption of the sample at max and finding the concentration from the adsorption vs concentration graph. The concentration can also be determined using linear regression analysis.
UV-Vis spectroscopy: Beer-Lambert law What is the concentration of A in a sample the has an adsorption of 0.32 @ 485 mn?
Infrared (IR) Spectroscopy Bonds between atoms act like springs – bond lengths are really average distances (e.g. C-C single bond = 1.48 Å; C-C bond in aromatic ring = 1.397 Å). How easily atoms move toward or away from each other (bond stiffness) is related to the strength of the bond – stronger bonds vibrate at a higher frequency and require higher energy infrared light to change the vibration.
Infrared (IR) Spectroscopy Masses of bonded atoms also affect vibrational frequencies. Bigger atoms (more mass or higher atomic weight) in a bond lower the frequency of the vibration.
In order to interact with IR light, a bond has to undergo a change in dipole moment as a result of the vibration. This means the bond has to have a dipole moment to begin with. The bigger the dipole moment, the more strongly IR light will be absorbed. Polar bonds = IR active bonds Nonpolar, symmetric bonds = IR inactive bonds
There are different ways in which bonds can vibrate. antisymmetric stretching in-plane bending (scissoring) symmetric stretching More complicated molecules have more fundamental vibrational modes and more complicated spectra.
Number of molecular vibrations Number of fundamental vibrational modes = 3n – 6 where n = the number of atoms in the molecule. Water 3 atoms 3(3) – 6 = 3 fundamental vibrational modes C6H12 18 atoms 3(18) – 6 = 48 fundamental vibrational modes Other vibrational modes are possible (out-of-plane bending) and one part of a molecule can affect the vibrating bonds in another part. Secondary interactions increase the complexity of the IR spectrum of a molecule.
A modern Fourier-Transform IR spectrometer reads all wavelengths at once, requiring a lower power IR source and completing the spectrum in a matter of seconds. The interferogram produced by the FT-IR is converted by a computer program to the same kind of spectrum produced from an instrument that reads one wavelength at a time.
Example IR spectrum: 100 Each dip in %T toward 0 represents light that is being absorbed by vibrating polar bonds. The dips are called peaks. Peaks can be strong, weak, or medium. Peaks can be broad or sharp. Transmittance (%T) 50 0 1000 500 4000 3000 1500 2000 Wavenumber (cm1) Fingerprint region – 600 cm1 to 1400 cm1 – region of the spectrum where most of the complex rocking and out-of-plane vibrations are found. Each compound (except enantiomers) has a unique fingerprint.
IR spectra have two primary uses: • Certain peaks and peak patterns are associated with specific structural features. Therefore IR is used to identify important structural features (i.e. functional groups) present in the compound.
IR spectra have two primary uses: • Since almost all compounds have unique fingerprint regions, IR spectra can confirm or deny the identity of a compound. If the fingerprint region of an unknown compound is compared to a standard reference sample and the fingerprint regions match, the compounds should be the same. If fingerprint regions do not match, the compounds must be different.
1 - two spikes 2 - one spike sp C-H stretch sp3 C-H stretch sp2 C-H stretch aldehydes also show two C-H stretching peaks for the CHO group at about 2700 cm1 and 2800 cm1 ester C-0 often just above 1200 cm1
Additional things to keep in mind: • Sometimes the absence of a peak is just as helpful as the presence of a peak in determining what kind of compound you have. (e.g. No strong peak near 1700 cm1 eliminates ketones, aldehydes, esters, and carboxylic acids as possibilities for your compound. No strong, broad peak near 1640 cm1 eliminates amide.)
Example 1: no C=O stretch no C-O stretch no O-H no N-H C-H bending no C=C stretch sp3 C-H stretch no sp or sp2 C-H stretch Conclusion: This compound is a simple alkane.
Example 2: O-H stretch of acid C=O stretch aromatic C=C stretch Conclusion: Aromatic carboxylic acid
Example 3: harmonics associated with monosubstituted ring sp3 C-H stretch aromatic C=C stretch C-O stretch sp2 C-H stretch O-H stretch peaks in this area can tell you if a ring is monosubstituted, o-, p-, or m-disubstituted etc. Conclusion: aromatic alcohol with alkyl portion
Example 4: sp2 C-H stretch C=O stretch above 1750 cm1 indicates ester aromatic C=C stretch C-O stretch of ester Conclusion: This is an aromatic ester
Example 5: Shows up with 1 amines (not C=C) 1 N-H stretch C-H bending sp3 C-H stretch Conclusion: aliphatic 1 amine
Example 6: no C=O no C=C 2 N-H stretch sp3 C-H stretch Conclusion: aliphatic 2 amine
Example 7: sp2 C-H stretch 1 N-H stretch C=O of amide – also conjugated aromatic C=C Conclusion: aromatic 1 amide (conjugated)
Example 8: CΞC stretch sp3 C-H stretch sp C-H stretch Conclusion: terminal alkyne
Example 9: too high for N-H CΞN stretch sp3 C-H stretch Conclusion: aliphatic nitrile
Example 10: sp3 C-H stretch 1 N-H stretch C=O stretch of amide Conclusion: aliphatic 1 amide
Example 11: no O-H stretch no aldehyde C-H stretch sp3 C-H stretch C=O stretch of ketone, aldehyde, or acid Conclusion: aliphatic ketone
Example 12: aldehyde C-H stretch aromatic C=C C=O stretch of ketone, aldehyde, or acid Conclusion: aromatic aldehyde