Download
1 / 32
380 likes | 648 Views
Risk, Return, and the Capital Asset Pricing Model. Chapter 7. Expected Returns. Decisions must be based on expected returns. Methods used to estimate expected return. Historical approach. Probabilistic approach. Risk-based approach. Expected Returns: The Historical Approach.

E N D
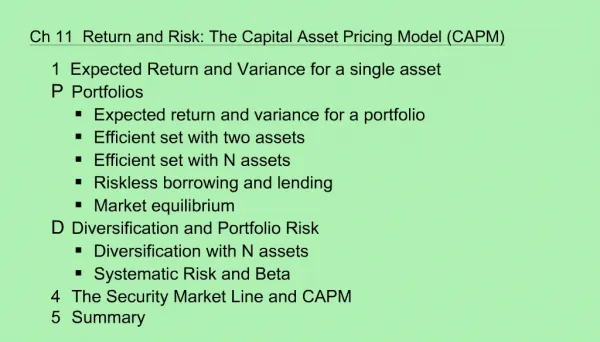
Expected Returns Decisions must be based on expected returns Methods used to estimate expected return Historical approach Probabilistic approach Risk-based approach
Expected Returns: The Historical Approach Assume that distribution of expected returns will be similar to historical distribution of returns. Using 1900-2006 annual returns, the average risk premium for U.S. stocks relative to Treasury bills is 7.7%. Treasury bills currently offer a 2% yield to maturity. Expected return on U.S. stocks: 7.7% + 2% = 9.7% Can the historical approach be used to estimate the expected return of an individual stock?
Limitations of historical approach for individual stocks May reflect GM’s past more than its future Many stocks do not have a long history to forecast expected return Expected Returns: The Historical Approach Assume General Motors’ long-run average return is 15.0%. Treasury bills’ average return over same period is 4%. GM’s historical risk premium: 15% - 4% = 11% GM’s expected return = Current T-bill rate + GM’s historical risk premium = 2% + 11% = 13%
Expected Returns: The Probabilistic Approach Identify all possible outcomes of returns and assign a probability to each possible outcome. For example, assign probabilities for possible states of economy: boom, expansion, and recession, and project the returns of GM stock for the three states. GM Expected Return = 0.20(-30%) + 0.70(15%) +0.10(55%) = 10%
Requires analysts to specify possible future outcomes for stock returns and to attach a probability to each return. Limitations of probabilistic approach Such assumptions are often based on historical data. Expected Returns: The Probabilistic Approach
Expected Returns: The Risk-Based Approach • This approach is more theoretically sound and used in practice by most corporate finance professionals. • Two-step process: • Measure the risk of the asset. • Translate that risk measure into an expected return estimate.
Expected Returns: The Risk-Based Approach 1. Measure the risk of the asset. • Recall that • Systematic risks simultaneously affect many different securities. • The market pays investors for bearing systematic risk - the risk that cannot be eliminated through diversification. • Standard deviation measures an asset’s total risk, which is equal to the sum of its systematic and unsystematic components. How can we capture the systematic risk component of a stock’s volatility?
Expected Returns: The Risk-Based Approach • Collect data on a stock’s returns and returns on a market index • Plot the points on a scatter plot graph • Y-axis: stock’s return • X-axis: market’s return • Plot a line (using linear regression) through the points Slope of line equals beta, the sensitivity of a stock’s returns relative to changes in the overall market return. Beta is a measure of systematic risk for a particular security.
Fig. 7.1A Scatter Plot of Weekly Returns on The Sharper Image vs. The S&P 500 Stock Index
High Beta • By definition, the beta of the average stock equals 1.0. • The return on a high-beta stock like The Sharper Image experiences dramatic up-and-down swings when the market return moves. • Because The Sharper Image’s beta equals 1.44, we can say that the return on The Sharper Image’s shares moves, on average, 1.44 times as much as does the market return.
Fig. 7.1B Scatter Plot of Weekly Returns on ConAgra vs. The S&P 500 Stock Index
Low Beta • Because the ConAgra’sbeta equals 0.11, we can say that the return on The ConAgra’s shares moves, on average, 0.11 times as much as does the market return. • A stock that can gain or lose 12 percent in a week is volatile, but ConAgra’s volatility is only weakly related to fluctuations in the overall market. • Most of ConAgra’s risk is unsystematic and can be eliminated through diversification.
Expected Returns: The Risk-Based Approach 2. Translate that risk measure into an expected return estimate. • Plot beta against expected return for two assets: • A risk-free asset that pays 4% with certainty, with zero systematic risk and • An “average stock”, with beta equal to 1, with an expected return of 10%. • Draw a straight line connecting the two points. • Investors holding a stock with beta of 0.5 or 1.5, for example, can find the expected return on the line. Beta measures systematic risk and links the risk and expected return of an asset.
• ß = 1.5 Beta and Expected Returns Expected returns • 18% An investor willing to accept an average level of systematic risk, by holding a stock with a beta of 1.0, expects a return of 10%. By holding only the risk-free asset, an investor can earn 4%, without having to accept any systematic risk at all. • 14% • • 10% “average” stock • 4% Risk-free asset • • • • • • • • • • 0.2 0.4 0.6 0.8 1 1.2 1.4 1.6 1.8 2 Beta What is the expected return for stock with beta = 1.5?
Expected return of a portfolio with N securities E(Rp) = w1E(R1)+ w2E(R2)+…+wnE(Rn) • w1, w2 , … , wn : portfolio weights • E(R1), E(R2), …, E(RN): expected returns of securities Portfolio Expected Return How does the expected return of a portfolio relate to the expected returns of the securities in the portfolio? The portfolio expected return equals the weighted average of the portfolio assets’ expected returns.
Portfolio Expected Return E(Rp) = w1E(R1)+ w2E(R2)+…+wnE(Rn) E(Rp) = (0.125)(10%) + (0.25)(12%) + (0.125)(8%) + (0.5)(14%) = 12.25%
Portfolio Expected Return with Short Selling • Portfolio weights have to add up to one. • However, these weights need not necessarily fall between zero and one. • A negative portfolio weight means that rather than investing in the given asset, an individual is borrowing that asset, selling it, and using the proceeds to invest in something else.
Portfolio Expected Return with Short Selling Example • Rocket.com and BricksNMortar Inc currently sell for $10 and pay no dividends. You expect Rocket.com’s return next year to be 25%, while BricksNMortar will earn just 5%. • You have $1,000 to invest. To invest more in Rocket.com, you borrow 50 shares of BricksNMortar for one year. • Then, combine the funds from selling the BricksNMortar shares with your own money to purchase $1,500 (150 shares) of Rocket.com.
Portfolio Expected Return with Short Selling Your portfolio and its expected return now look like this: E(Rp) = w1E(R1)+ w2E(R2)+…+wnE(Rn) = (-0.5)(5%) + (1.5)(25%) = 35%
Portfolio Risk Portfolio risk is the weighted average of systematic risk (beta) of the portfolio constituent securities. ß P = (0.125)(1.00) + (0.25)(1.33) + (0.125)(0.67) + (0.50)(1.67) = 1.38 But portfolio volatility is not the same as the weighted average of all portfolio security volatilities.
The Security Market Line • Consider a portfolio composed of the following two assets: • An asset that pays a risk-free return Rf, , and • A market portfolio that contains some of every risky asset in the market. Security market line: the line connecting the risk-free asset and the market portfolio
Fig 7.3 The Security Market Line The Security Market Line shows how an investor can construct a portfolio of T-bills and the market portfolio to achieve the desired level of risk and return.
Return for bearing no market risk Portfolio’s exposure to market risk Reward for bearing market risk The Security Market Line and the CAPM The two-asset portfolio lies on security market line. Given two points (risk-free asset and market portfolio asset) on the security market line, the equation of the line is: E(Ri) = Rf + ß [E(Rm) – Rf] The equation represents the risk and return relationship predicted by the Capital Asset Pricing Model (CAPM).
The Security Market Line Plots relationship between expected return and betas. • In equilibrium, all assets lie on this line. • If individual stock or portfolio lies above the line: • Expected return is too high – stock is undervalued. • Investors bid up price until expected return falls. • If individual stock or portfolio lies below SML: • Expected return is too low – stock is overvalued. • Investors sell stock driving down price until expected return rises.
A - Undervalued • • A B • • B - Overvalued The Security Market Line E(RP) SML RM • • Slope = (y2-y1) / (x2-x1) = [E(RM) – RF] / (βM-0) = [E(RM) – RF] / (1-0) = E(RM) – RF = MarketRisk Premium RF • M =1.0 i
Are Stock Returns Predictable? Efficient market hypothesis (EMH): in an efficient market, prices rapidly incorporate all relevant information. Financial markets are larger, more competitive, more transparent, more homogeneous than product markets. Much harder to create value through financial activities. Changes in asset price respond only to new information. This implies that asset prices move almost randomly.
Are Stock Returns Predictable? If asset prices unpredictable, then what is the use of CAPM? CAPM gives analysts a model to measure the systematic risk of any asset. On average, assets with high systematic risk should earn higher returns than assets with low systematic risk. CAPM offers a way to compare risk and return on investments alternatives.
Risk, Return, and The Capital Asset Pricing Model • Decisions should be made based on expected returns. • Expected returns can be estimated using historical, probabilistic, or risk approaches. • Portfolio expected return/beta equals weighted average of the expected returns/beta of the assets in the portfolio. • CAPM predicts that the expected return on a stock depends on the stock’s beta, the risk-free rate and the market premium.