Download
1 / 50
500 likes | 626 Views
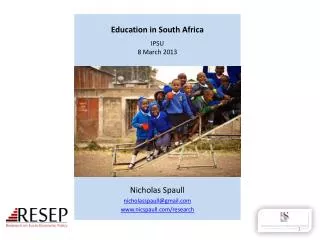
Effective Enrolment Creating a composite measure of educational access and educational quality to accurately describe education system performance in Sub-Saharan Africa. Nic Spaull & Stephen Taylor UFS Economics Seminar August 2013. Access & Quality.

E N D
Effective EnrolmentCreating a composite measure of educational access and educational quality to accurately describe education system performance in Sub-Saharan Africa Nic Spaull & Stephen Taylor UFS Economics Seminar August 2013
Access & Quality “Defining the scope of the problem of “lack of education” must begin with the objectives of education – which is to equip people with the range of competencies…necessary to lead productive and fulfilling lives fully integrated into their societies and communities. Many of the international goals are framed exclusively as targets for universal enrolments or universal completion. But getting and keeping children “in school” is merely a means to the more fundamental objectives of…. creating competencies and learning achievement” (Pritchett, 2004, p. 1).
Access & Quality “It is both conventional and convenient in policy discussions to concentrate on such things as years of school attainment or enrolment rates at schools. These things are readily observed and measured. They appear in administrative data, and they are published on a consistent basis in virtually all countries of the world. And they are very misleading in the policy debates. Cognitive skills are related, among other things, to both quantity and quality of schooling. But schooling that does not improve cognitive skills, measured here by comparable international tests of mathematics, science, and reading, has limited impact on aggregate economic outcomes and on economic development…We provide strong evidence that ignoring differences in cognitive skills significantly distorts the picture about the relationship between education and economic outcomes” (Hanushek & Woessmann, 2008, p. 608).
Context of research • Universal Declaration of Human Rights (1948) – Article 26 • “Everyone has the right to education. Education shall be free, at least in the elementary and fundamental stages. Elementary education shall be compulsory.” • Education For All (EFA) • Jomtien (Thailand), 1990 • Dakar (Senegal), 2000 • Goal 2 – Provide free and compulsory primary education for all • Goal 6 – Improve the quality of education • Difficult to combine access and quality • Monitoring reports and research groups usually focus on one or the other – i.e. EFA (access), SACMEQ/PASEC (quality) • UNESCO NER’s unreliable in many instances • Depend on two different data sources (population estimates and school census) • NER’s very dependent on whether students are correctly aged or not (low NER due to late enrolment) • (See Stukel & Feroz-Zada, 2010 of UIS)
Context of research (cont.) Trade-off between access & quality Fashionable to say: “We have made progress with access; now the challenge is quality.” • Crouch and Vinjevold (2006) argue that while most countries managed to improve both access and quality, the region of Southern Africa is unique in that many countries have over-emphasized “access at the expense of learning” (p. 8), thus creating an imbalance between access and quality and demonstrating that “the tension between access and quality is real” (p. 1). • Colclough, Kingdon and Patrinos (2009, p. 2) suggest that “in some African cases, the expansion of the primary system appears to have been accompanied by sharp declines in school quality, such that literacy and numeracy are no longer so readily delivered by the primary system.” • Zuze and Leibbrandt (2011), in view of the low quality of education observed in Uganda, suggest that the expansion should perhaps have been phased in more slowly so as to allow better planning and preparation. • Chimombo (2009, p. 309) argues that, “the impressive achievements made in improving access to school have to be balanced against issues of declining quality” and that the poor are most at risk of a consequently low quality education. • All of these statements contributes to an almost unquestioned perception that there is a trade-off between access to education and the quality thereof. • What causes a trade-off? • Children of lower SES entering the system • Resources are stretched due to more children • In some countries (e.g. Kenya & Tanzania) expansion was driven partly by the abolishment of fees. This further limits resources available to schools.
Status quo The extant literature on education in Africa is bifurcated in that reports eitherfocus on: This is problematic for 2 reasons: • Observing access to education without regard for the quality of that education clouds the analysis, primarily because labour-market prospects and social mobility are driven by cognitive skills acquired, not years of education attained, and • Analysing the quality of education without taking cognizance of the enrolment and dropout profiles of the countries under review is likely to bias the results due to sample selection But not both OR
Aim of the research • Provide a composite measure of educational system performance • Combine measures of access and quality • Data: SACMEQ III and DHS • Is there really an access-quality trade-off in SSA? • Compare 13 SSA countries’ education systems in 2000 and 2007 • Data: SACMEQ II (2000) and SACMEQ III (2007)
Current research Core assumptions: • Schooling that does not improve cognitive outcomes is of limited value. • Simple enrolment rates overstate the success of education systems in Africa. • Children should have acquired basic numeracy and literacy skills by the end of grade 6. • Children who have either dropped out prior to grade 6 or never enrolled in the first place are functionally illiterate and functionally innumerate.
Background: Data SACMEQ • Southern and Eastern African Consortium for Monitoring Educational Quality • 14 participating countries • SACMEQ II (2000), SACMEQ III (2007) • Background survey • Testing : • Gr 6 Numeracy • Gr 6 Literacy • HIV/AIDS Health knowledge SACMEQ III: South Africa • 9071 Grade 6 students • 1163 Grade 6 teachers • 392 primary schools • See SACMEQ website for research
Functionally literate/numerateSACMEQ • If a student reaches Level 3 for Reading and Mathematics, they are classified as being functionally literate and functionally literate. • If not, they are classified as functionally illiterate and functionally innumerate. By this definition, a functionally illiterate learner cannot read a short and simple text and extract meaning, while a functionally innumerate learner cannot translate graphical information into fractions or interpret everyday units of measurement. • An important innovation in the paper is our assumption that grade-6 aged students that are not attending school (due to dropout or non-enrolment) are functionally illiterate and functionally innumerate….this allows us to combine access (binary) and quality (continuous) variables. • See Shabalala, 2005: p222 Basic reading (L3) Interprets meaning (by matching words and phrases, completing a sentence, or matching adjacent words) in a short and simple text by reading on or reading back. Basic numeracy (L3) Translates verbal information presented in a sentence, simple graph or table using one arithmetic operation in several repeated steps. Translates graphical information into fractions. Interprets place value in whole numbers up to thousands. Interprets simple common everyday units of measurement.
Combine access and quality • Assume those of grade 6 age that are not in school are illiterate and innumerate • “Correcting” for differential enrolment rates across countries and across sub-groups within a country
Functional literacy&functional numeracy 6th 5th Basic reading (L3) Interprets meaning (by matching words and phrases, completing a sentence, or matching adjacent words) in a short and simple text by reading on or reading back. Basic numeracy (L3) Translates verbal information presented in a sentence, simple graph or table using one arithmetic operation in several repeated steps. Translates graphical information into fractions. Interprets place value in whole numbers up to thousands. Interprets simple common everyday units of measurement.
Differential access by subgroups • Different enrolment & achievement profiles for different sub-groups of the national population (averages shroud inequalities) • Urban vs Rural (multiply enrolment and literacy rates) • Boys vs Girls (multiply enrolment and literacy rates) • Wealthy vs Poor (CANNOT simply multiply enrolment and literacy rates)
Correcting for differential access by quintile Functionally illiterate 21% of SACMEQ students come from quintile 5 19% of SACMEQ students come from quintile 1
Literacy gaps by gender, location & wealth • Does gender deserve the priority it gets when location and wealth gaps are MUCH larger for these ten countries?
Numeracy gaps by gender, location & wealth • Does gender deserve the priority it gets when location and wealth gaps are MUCH larger for these ten countries?
Policy impact – post 2015 MDGs? (Save the Children, 2013)
A trade-off between access & quality? The numbers of grade 6 children reaching each level of achievement: Mozambique reading Population growth (2000-2007) 20.6%.
A trade-off between access & quality? The numbers of grade 6 children reaching each level of achievement: Tanzania maths Population growth (2000-2007) 16.8%.
A trade-off between access & quality? TAULL ratios: The number functionally literate (numerate) in 2007: The number functionally literate (numerate) in 2000
A trade-off between access & quality? The TAULL story: Putting everything together
Concluding discussion • Our method of combining access (NAR) and quality (literacy/numeracy) is the most accurate, reliable and well-rounded measure of overall educational performance in SSA (as far as we are aware). • The main innovation is the assumption that grade-6 aged students that are not attending school (dropout or non-enrolment) are functionally illiterate and functionally innumerate, allowing us to combine binary and continuous measures. • Although it is uncomplicated it has not been done before for SSA • Using DHS for cross-country comparisons of attendance rates is methodologically more sound than UNESCO’s NER • The case for a trade-off between access and quality (as measured by outcomes) has been overstated, at least for most countries included here. Countries can and have managed to increase both access to education, and the quality thereof. • Resources are often stretched however, limited impact on performance – able to do more with less per pupil. • Only one country could not keep up with population growth: Malawi
Papers • Full papers available on Stellenbosch Economics Website (WP Series): • “Effective enrolment” - Creating a composite measure of educational access and educational quality to accurately describe education system performance in sub-Saharan Africa http://www.ekon.sun.ac.za/wpapers/2012/wp212012 • The effects of rapidly expanding primary school access on effective learning: The case of Southern and Eastern Africa since 2000 http://www.ekon.sun.ac.za/wpapers/2013/wp012013
References • Filmer, D. (2010). Educational Attainment and Enrollment around the World. The World Bank. econ.worldbank.org/projects/edattain: Development Research Group. • Filmer, D., & Pritchett, T. (1999). The Effect of Household Wealth on Educational Attainment: Evidence from 35 Countries. Population and Development Review, 25(1), 85-120. • Hanushek, E., & Woessmann, L. (2008). The Role of Cognitive Skills in Economic Development. Journal of Economic Literature, 46(3), 607-668. • Hungi, N. (2010). What are the levels and trends in grade repetition? www.sacmeq.org: Southern and East African Consortium for Monitoring Educational Quality . • Hungi, N., Makuwa, D., Ross, K., Saito, M., Dolata, S., van Capelle, F., et al. (2010). SACMEQ III Project Results: Pupil Achievement Levels in Reading and Mathematics. Paris: Southern and Eastern Africa Consortium for Monitoring Educational Quality. • Lambin, R. (1995). "What can Planners Expect from International Quantitative Studies?" Reflections on Educational Achievement: Papers in Honour of T. Neville Postlethwaite.WaxmannVerlag. • Lewin, K. (2007). Improving Access, Equity and Transitions in Education: Creating a Research Agenda. Co. Sussex: Consortium for research on Educational Access, Transitions and Equity (CREATE). • Lewin, K. (2009). Access to education in sub-Saharan Africa: patterns, problems and possibilities. Comparative Education, 45(2). • Pritchett, L. Towards a New Consensus for Addressing the Global Challenge of the Lack of Education. Copenhagen: Copenhagen Consensus, 2004. • Ross, K., Saito, M., Dolata, S., Ikeda, M., Zuze, L., Murimba, S., et al. (2005). The Conduct of the SACMEQ II Project. In E. Onsomu, J. Nzomo, & C. Obiero, The SACMEQ II Project in Kenya: A Study of the Conditions of Schooling and the Quality of Education. Harare: SACMEQ. • SACMEQ. (2010). SACMEQ III Project Results: Pupil Achievement Levels in Reading and Mathematics. Retrieved January 2011, from Southern and Eastern Africa Consortium for Monitoring Educational Quality: http://www.sacmeq.org/downloads/sacmeqIII/WD01_SACMEQ_III_Results_Pupil_Achievement.pdf • Sen, A. (1999). Development as Freedom. Oxford: Oxford University Press • UIS. (2009). Global Education Digest 2009: Comparing Education Statistics Across the World. Montreal: UNESCO Institute for Statistics. • UNESCO. (2005). Education For All Global Monitoring Report 2005. Paris: UNESCO Publishing.
Sense-check Table 3: Grade survival rate [Data: World Bank survey data, Filmer (2010)] • What about literate pre-Grade 6 dropout? • Perhaps children from SWA / TAN / KEN (where literacy rates in Gr6 are high) will be literate even though they dropout in Gr5? • % children who survive to grade 5 but not grade six is never > 5% • School system has still “failed” these children
Geographical differences 6th 8th
High level skills Inferential reading (L6) Reads on and reads back through longer texts (narrative, document or expository) in order to combine information from various parts of the text so as to infer the writer’s purpose. Mathematically skilled (L6) Solves multiple-operation problems (using the correct order of arithmetic operations) involving fractions, ratios, and decimals. Translates verbal and graphic representation information into symbolic, algebraic, and equation form in order to solve a given mathematical problem. Checks and estimates answers using external knowledge (not provided within the problem).
High level skills Analytical reading (L7) Locates information in longer texts (narrative, document or expository) by reading on and reading back in order to combine information from various parts of the text so as to infer the writer’s personal beliefs (value systems, prejudices, and/or biases). Concrete Problem solving (L7) Extracts and converts (for example, with respect to measurement units) information from tables, charts, visual and symbolic presentations in order to identify, and then solves multi-step problems.
Funding 6th 5th
A trade-off between access & quality? SACMEQ achievement vs. Net Attendance Rates
A trade-off between access & quality? Change in SACMEQ achievement vs. Change in grade 6 enrolments
A trade-off between access & quality? The numbers of grade 6 children reaching each level of achievement: Kenya reading Population growth (2000-2007) 6.3%.
A trade-off between access & quality? The numbers of grade 6 children reaching each level of achievement: Uganda maths Population growth (2000-2007) 25.6%.
A trade-off between access & quality? The numbers of grade 6 children reaching each level of achievement: Malawi reading Population growth (2000-2007) 26.8%.
A trade-off between access & quality? The TAULL story: Putting everything together
Concluding discussion • Our method of combining access (NAR) and quality (literacy/numeracy) is the most accurate, reliable and well-rounded measure of overall educational performance in SSA (as far as we are aware). • The main innovation is the assumption that grade-6 aged students that are not attending school (dropout or non-enrolment) are functionally illiterate and functionally innumerate, allowing us to combine binary and continuous measures. • Although it is uncomplicated it has not been done before for SSA • Using DHS for cross-country comparisons of attendance rates is methodologically more sound than UNESCO’s NER • The case for a trade-off between access and quality (as measured by outcomes) has been overstated, at least for most countries included here. Countries can and have managed to increase both access to education, and the quality thereof. • Resources are often stretched however, limited impact on performance – able to do more with less per pupil. • Only one country could not keep up with population growth: Malawi
Further research • Does increased access to primary school lead to increase access to secondary and tertiary education? • Somerset (2007) argues that the abolition of school fees in Kenya in 1974 led to a massive increase in grade 1 enrolments accompanied by a huge increase in drop-out thereafter. • Our preliminary analysis suggests that the big expanders in SACMEQ also improved wrt survival to grade 9 and enrolment amongst 16 year-olds (using consecutive DHS’s) • However, bottlenecks can mean that expanded access can have the perverse impact of SES becoming a more important determinant of access to higher levels of education. (Lewin, 2007)
Geographical differences 5th 7th