Download
1 / 32
320 likes | 513 Views
Practical Software and Systems Measurement Objective Information for Decision Makers. PSM. System & Software Architecture Performance Measurement Workshop 31 July 2012 Paul Kohl – Lockheed Martin Alejandro Bianchi – Liveware IS s.a . System & Software Architecture Performance Measurement.

E N D
Practical Software and Systems MeasurementObjective Information for Decision Makers PSM System & Software Architecture Performance Measurement Workshop 31 July 2012 Paul Kohl – Lockheed Martin Alejandro Bianchi – Liveware IS s.a.
Read Ahead Materials Introduction
Why? • Outgrowth of a NDIA/PSM study1 • Identify a set of leading indicators that provide insight into technical performance • Build upon objective measures in common practice in industry, government, and accepted standards. • Select objective measures based on essential attributes (e.g., relevance, completeness, timeliness, simplicity, cost effectiveness, repeatability, and accuracy). • Measures should be commonly and readily available • Results published as NDIA System Development Performance Measurement Report, December 2011 • Architecture was a high priority area but no indicators were identified that met criteria • This is an attempt to define measures that can become the leading indicators • Introduce them into common practice • Using means that are easy to implement 1NDIA System Development Performance Measurement Report, December 2011
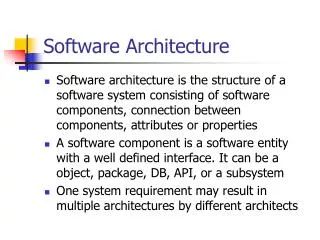
What is an Architecture? • ISO/IEC/IEEE 42010-2011 - IEEE Systems and software engineering -- Architecture description • Architecture (system) – fundamental concepts or properties of a system in its environment embodied in its elements, relationships, and in the principles of its design and evolution • Elements • Structure • Behavior • Data • Procedures • Relationships • Internal • External • Principles • Architecture Rules and Overarching Guidance
Architecture Design Process Activities/Tasks • ISO/IEC/IEEE 15288 Architecture Activities and Tasks • INCOSE Handbook para 4.3.1.5 Activities and Tasks
Outcomes of AD process • Per ISO/IEC/IEEE 15288 – “The purpose of the AD process is to synthesize a solution that satisfied system requirements” and has the following outcomes: • An architecture design baseline • An implementable set of system element descriptions that satisfy the requirements for the system is specified • The interface requirements are incorporated into the architecture design solution • The traceability of the architectural design to system requirements is established • A basis for verifying the system elements is defined • A basis for the integration of system elements is established • These outcomes are all objectively measurable
Traditional Architecture Measurement • Traditionally architecture quality was determined at the milestone reviews and was a lagging indicator • Reviewers were briefed and had access to documents and artifacts to determine: • Maturity and Consistency • Are all the elements required present at the current program phase? • Are all requirements accounted for? • Does it tie together? Within an architecture level? Between levels? Between artifact types? • Best Architecture= Product (Solution) Quality • Does it meet the stakeholder needs? • Does it avoid known architecture deficiencies? • Does it do so better than alternatives? • Difficult to see full picture • Even harder to determine consistency
Program Manager Leading Indicator Needs • Does the architecture provide the right solution to the problem and does it meet all the requirements? • Best • Requirements Traceability • Is the architecture going to be done on time? • Progress/Complete • Stability • Will the architecture be low in defects? • No missing data • Entered data is correct • Data is consistent between artifacts and/or system elements?
Additional Measurement Needs • Process efficiency • Can the process be done better to reduce cost or improve quality? • Size / Complexity • How big and/or complex is the architecture effort so I can compare to other efforts? • Cost • What was the Total effort? • What effort was required for each task / system element/ artifact?
Measurement Beyond the Program • Enterprise type metrics related to architecture • Process efficiency • ROI in architecture • Market Share (meeting customer/stakeholder needs) • Need to identify base measures of architectures that can support the above
Architecture Measures • Architecture measurement requires a set of measures to fully address the needs • Measures may be: • Objective (Quantitative) where discrete elements can be counted or otherwise measured or • Subjective (Quality) where human judgment is needed to fully evaluate an aspect of the architecture • Measures should be: • Based on common practice and standards • Readily obtainable • Reflect essential attributes of architecture
Measurement in a model based environment • Model based architecting (or architecture modeling) makes the evaluation of completeness and consistency feasible as a leading indicator) • Architecture tools provide better insight into consistency and completeness via pre-defined reports or by directly accessing the underlying database • Makes it easy(ier) to count artifacts and determine change dates • Easier to determine empty data fields • Easier to make consistency checks between architecture artifacts (parent-child, peer-to-peer) • Quantitative measures are now available
Impact of Architecture Frameworks on Measurement • Architecture Frameworks have defined stable sets of process activities (TOGAF) or viewpoint/models (DoDAF & FEAF) • The latter provide items which may be measured • When combined with the advances in modeling tools we have a standard set of products which may be measured with relative ease • Size • % Complete • Conformance to standard • Adequacy of representation (right viewpoints & well represented)
Quantitative Measurement • Goal is to measure whether an architecture is complete and consistent • Easier with model-based architecting • Anticipated artifacts / completed artifacts • Internal reports showing missing data and inconsistencies between artifacts • Supported by many of the architecture tools but requires effort on the part of the program to create and customize • Models help visualize heuristics as well • Examples • Progress chart • Requirements trace reports (SELI) • TBx closure rate (SELI) • Empty data field counts • Visual reviews of artifacts • Other reports from the modeling tool database that address consistency
Additional Quantitative Measurables • % of functional requirements with elaborated behavior • % of requirements allocated/traced to an element of the architecture • Tables of normalized interface counts across elements • Level of detail of behavior definition • # of defects per element • From Seidl & Sneed, Modeling Metrics for UML Diagrams, Testing Experience, Sep-Oct 2011 • Formulas for calculating measures of a UML software architecture. Sample measures include: • Design Complexity (1-(# Design Entities/# Design Relationships) • Degree of Coupling • Degree of Consistency • Degree of Completeness • Applicable to system architectures as well • Adaptable to other modeling languages in a similar fashion
Qualitative Measurement • Goal is to ensure the architecture is correct and satisfies the needs • Does it meets stakeholder needs within the program constraints? • Is it better than the alternative architectures in satisfying stakeholder needs? • Still somewhat subjective but has aspects that can be measured • Can only be determined in comparison to the alternatives • TPMs and MOE/KPP satisfaction compared • Examples • TPM/MOE radar charts • Est. At Completion vs TPM/MOE • Architecture design trade study records
Additional Qualitative Measurables • Reusability • Maintainability • Scalability • Risk in execution • Architecture build out • Implementation (manufacturability or missing skill sets) • Uncertainty of evaluation of the other factors/measures and the potential impact of being wrong • Technical Risk • (has its own set of measures and won’t be covered)
Example Architecture “Radar” Chart / Table • Key attributes • Must haves • Evaluate as true/false • Examples: • Completeness of requirements coverage • Threshold performance Attribute 2 Attribute 1 Attribute 3 “Utility Function” for the architecture assessment is a simple weighted sum of the assessed attribute values… repeat for each candidate architecture! Attribute 4 Attribute N Attribute 5
“The eye is a fine architect. Believe it” Werner Von Braun, 1950 Structural Heuristics “A good solution somehow looks nice” • Robert Spinrad, 1991
Heuristics • Additional ways to measure architecture quality • Heuristics – “Does it look right” • Review of the model artifacts can sometimes indicate if an architecture exhibits good / bad characteristics such as low cohesion or high levels of coupling • Internal metrics • Number of internal interfaces • Number of requirements per architecture element can indicate an imbalance • Coupling counts • Heuristics and expert review are experience based • Not generally directly measurable using quantitative means • If not applied early become a lagging indicator
Heuristics • Loose coupling (McCabe 1976, Carson 2000) • Number, type of interfaces • What is “too many” ( “tight coupling”)? • Functional Cohesion • Quantity of data between elements • What is “too much data between elements”? • Can we identify specific architecture measures for these and define thresholds? • Can these be compensated by other program elements (cf., Gau Pagnanelli et al., INCOSE 2012)?
Heuristics Example High External Complexity Low External Complexity Which Partitioning is Better? Why?
Architectural Characteristics Low General High Low Many System of Systems Multi-Enterprise or Multi-platform System Enterprise or Platform Subsystem Self contained functionality Component (Set of) OS address space(s) Software, Hardware, and User/Operators Autonomy Organizational Owner Ability to enforce Implementation Uniformity Acceptance Criteria Coupling High Specific Low High One
Additional Heuristics • Design patterns in the architecture that provide warning that something might be amiss • System Architectures • Functionality (for a single capability) scattered between multiple architecture elements • Functionality grouped with unlike functionality • Ambiguous interfaces without clear definitions • Functionality which requires extensive interaction between elements • SW Architectures • Ambiguous interfaces • Extraneous connectors (two types of connectors used to link SW components) • Excessive interaction requirements between SW components
Heuristics Application • Heuristics must be applied within the architecture team to be effective • Utilized as part of artifact/product inspections • Required application prior to baselining of products Otherwise • Heuristics become a lagging indicator • Found at milestone reviews • Become defects
Other Sources of Heuristics • Rechtin and Maier, 2009, The Art of Systems Architecting, 3d ed. • Identifying Architectural Bad Smells, Garcia, Popescu, Edwards and Medvidovic (undated) • USC database • Personal experience (usually hard won)
Workshop Objectives • Identify the key attributes of architecture to be measured • Define a set of architecture measures that provide insight into the architecture • Base and/or composite (derived) • Support program leadership needs for leading indicators • Are quantitative • Are readily obtainable • Recommend means/methods for obtaining the measures • Modeling tools • Requirement tools • Outputs from related processes • Fill in the PSM template for the measures