Download

1 / 16
170 likes | 271 Views
Federal Traffic Safety Program History. 1998 - 2005. TEA-21. 1998. 2004. Federal Traffic Safety Program History. 2005 - Current. 1998 - 2005. TEA-21. SAFETEA-LU. 1998. 2004. 2005. 2006. 2007. 2009. CHSP - TZD. Federal Traffic Safety Program History. 2005 - Current. 1998 - 2005.

E N D
Federal Traffic Safety Program History 1998 - 2005 TEA-21 1998 2004
Federal Traffic Safety Program History 2005 - Current 1998 - 2005 TEA-21 SAFETEA-LU 1998 2004 2005 2006 2007 2009 CHSP - TZD
Federal Traffic Safety Program History 2005 - Current 1998 - 2005 TEA-21 SAFETEA-LU 1998 2004 2005 2006 2007 2009 CSF $ CHSP - TZD
Federal Traffic Safety Program History 2005 - Current 1998 - 2005 TEA-21 SAFETEA-LU 1998 2004 2005 2006 2007 2009 SHSP CSF $$ CSF $ CHSP - TZD
Strategic Highway Safety Plan and Highway Safety Improvement Program • Stand Alone Safety Project • Data Driven • Low Cost • Proactive • Systematic
Funding • Federal SAFETEA-LU • Highway Safety Improvement Program (HSIP) • Local HSIP & High Risk Rural Roads Program • $13.5 Million (2009 - 2010) • $13.1 Million (2011 - 2012) • $3.3 Million – Road Safety Plans • County Highway Safety Program • $2.0 Million (2005 - 2006) • $2.0 Million (2006 – 2007) • $4.2 Million (2007 - 2008)
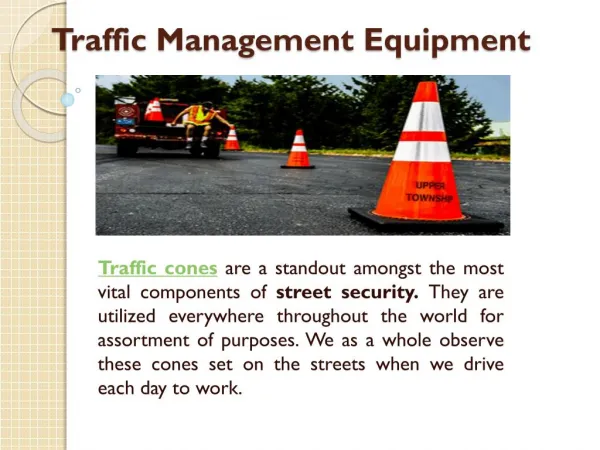
Example – Typical Intersection Strategies ChangeIntersectionType Street Lighting Dynamic Warning Signs IndirectTurns Enhanced Signing and Delineation Improve Sight Distance
HSIP Program • Challenge to determine where to focus safety funds • Black spots are infrequent on local roads • Fatal and Severe injury crashes are random on local roads
141,000 miles of Roadway • 900 miles of Interstate • 11k miles of Trunk Highway • 45k miles of County Road • 22k miles of City Streets • 62k miles of Township/Other roads 2009 K & A Crashes • 421 Fatalities • 1,036 Severe Injury Crashes 2 1 4 3 5 Minnesota 8 6 7
HSIP Program • Challenge to determine where to focus safety funds • Black spots are infrequent on local roads • Fatal and Severe injury crashes are random on local roads County Roads • 2,089 Severe Crashes • 45,000 miles of road • 0.05 severe crashes per mile Trunk Highway • 2,168 Severe Crashes • 12,000 miles of road • 0.18 severe crashes per mile
Federal Traffic Safety Program History 2005 - Current 1998 - 2005 TEA-21 SAFETEA-LU 1998 2004 2005 2006 2007 2009 SHSP CRSP CSF $$ CSF $ CHSP - TZD