Download
1 / 10
100 likes | 225 Views
What does a population that is normally distributed look like?. = 80 and = 10. X. 50. 60. 70. 80. 90. 100. 110. Empirical Rule. 68%. 95%. 99.7%. 68-95-99.7% RULE. Empirical Rule —restated.

E N D
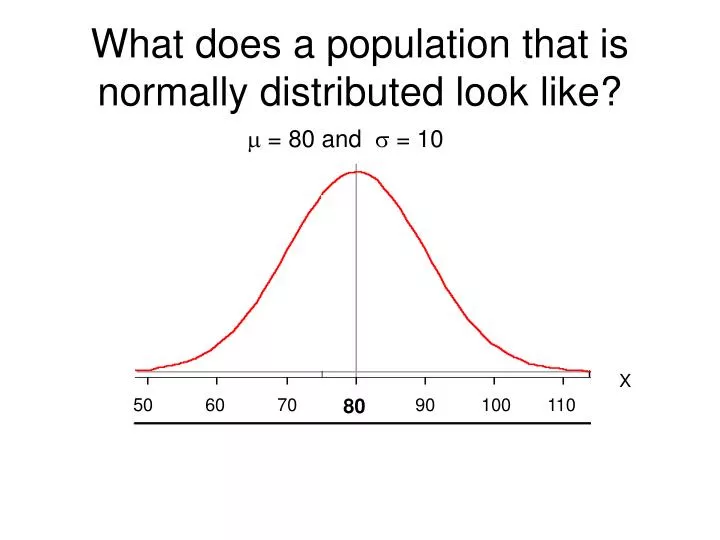
What does a population that is normally distributed look like? = 80 and = 10 X 50 60 70 80 90 100 110
Empirical Rule 68% 95% 99.7% 68-95-99.7% RULE
EmpiricalRule—restated 68% of the data values fall within 1standard deviation of the mean in either direction 95% of the data values fall within 2standard deviation of the mean in either direction 99.7% of the data values fall within 3standard deviation of the mean in either direction Remember values in a data set must appear to be a normal bell-shaped histogram, dotplot, or stemplot to use the Empirical Rule!
Empirical Rule 34% 34% 68% 47.5% 47.5% 95% 49.85% 49.85% 99.7%
Average American adult male height is 69 inches (5’ 9”) tall with a standard deviation of 2.5 inches.
Empirical Rule What is the likelihood that a randomly selected adult male would have a height less than 69 inches? Answer: P(h < 69) = .50 P represents Probability h represents one adult male height
Using the Empirical Rule What is the likelihood that a randomly selected adult male will have a height between 64 and 74 inches? P(64 < h < 74) = .95
Using Empirical Rule What is the likelihood that a randomly selected adult male would have a height of less than 66.5 inches? P(h < 66.5) = 1 – (.50 + .34) = .16 OR .50 - .34 = .16
Using Empirical Rule What is the likelihood that a randomly selected adult male would have a height of greater than 74 inches? P(h > 74) = 1 – P(h 74) = 1 – (.50 + .47.5) = 1 - .975 = .025
Using Empirical Rule--Let H~N(69, 2.5) What is the probability that a randomly selected adult male would have a height between 64 and 76.5 inches? P(64 < h < 76.5) = .475 + .4985 = .9735