Download
1 / 5
50 likes | 205 Views
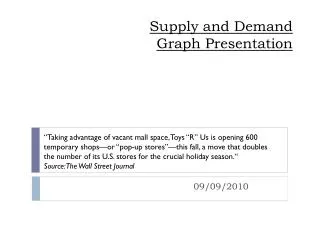
“Taking advantage of vacant mall space, Toys “R” Us is opening 600 temporary shops—or “pop-up stores”—this fall, a move that doubles the number of its U.S. stores for the crucial holiday season.“ Source: The Wall Street Journal . Supply and Demand Graph Presentation. 09/0 9 /2010.

E N D
“Taking advantage of vacant mall space, Toys “R” Us is opening 600 temporary shops—or “pop-up stores”—this fall, a move that doubles the number of its U.S. stores for the crucial holiday season.“ Source: The Wall Street Journal Supply and Demand Graph Presentation 09/09/2010
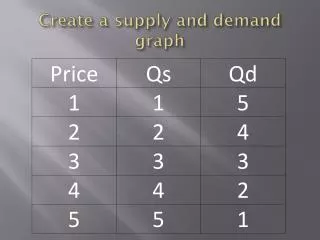
Toys “R” Us Regular Market Price 0S D Equilibrium Price Equilibrium Quantity Quantity
Toys “R” Us Holiday Season • As Toys “R” Us opens more shops, the supply of goods increases as well, causing a surplus. If all else remains the same, in order to erase this surplus, the company has to decrease prices. Although the Equilibrium price falls, both the quantity demanded and the Equilibrium Quantity increase. “The toy retailer is super-sizing a bet it made last year when it opened 90 temporary mall-based Toys “R” Us Express stores during the holidays… “ - The Wall Street Journal. Price 0S D 1S Equilibrium Price Equilibrium Quantity Quantity
Economic fact – Increase in Supply • - as the supply increases, there is no change in demand. • - the fall in price brings an increase in the quantity demanded – a movement along the demand curve.