Download
1 / 1
10 likes | 175 Views
Predictive Performance of a Myelosuppression Model for Dose Individualization; Impact of Type and Amount of Information Provided Johan E. Wallin, Lena E. Friberg and Mats O. Karlsson Division of Pharmacokinetics & Drug Therapy, Uppsala University, Sweden. Background.

E N D
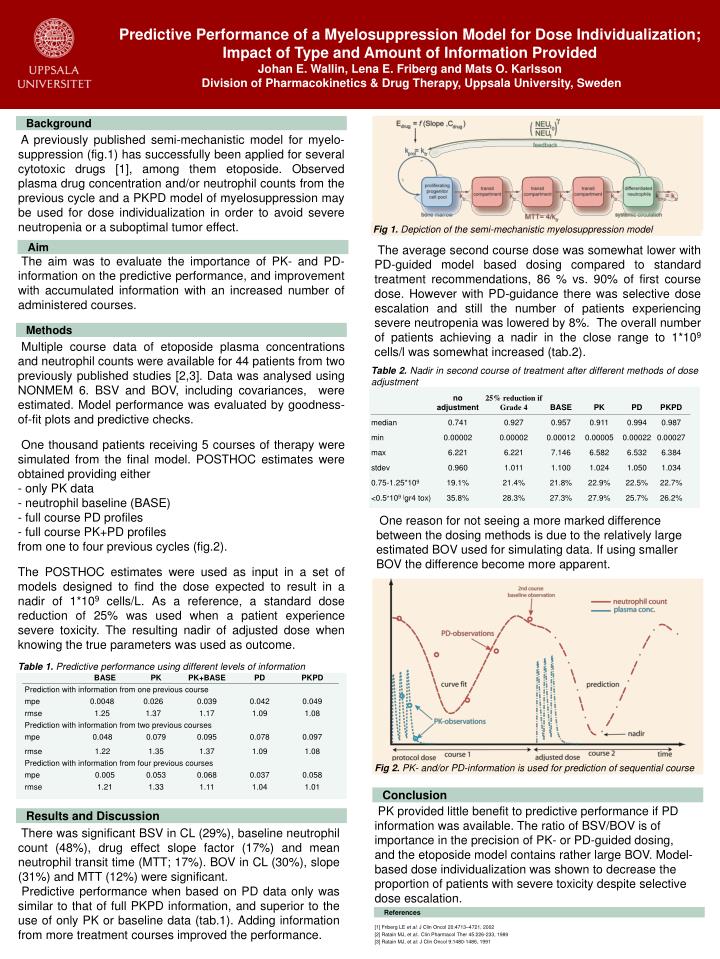
Predictive Performance of a Myelosuppression Model for Dose Individualization; Impact of Type and Amount of Information ProvidedJohan E. Wallin, Lena E. Friberg and Mats O. KarlssonDivision of Pharmacokinetics & Drug Therapy, Uppsala University, Sweden Background A previously published semi-mechanistic model for myelo-suppression (fig.1) has successfully been applied for several cytotoxic drugs [1], among them etoposide. Observed plasma drug concentration and/or neutrophil counts from the previous cycle and a PKPD model of myelosuppression may be used for dose individualization in order to avoid severe neutropenia or a suboptimal tumor effect. Fig 1. Depiction of the semi-mechanistic myelosuppression model Aim The average second course dose was somewhat lower with PD-guided model based dosing compared to standard treatment recommendations, 86 % vs. 90% of first course dose. However with PD-guidance there was selective dose escalation and still the number of patients experiencing severe neutropenia was lowered by 8%. The overall number of patients achieving a nadir in the close range to 1*109 cells/l was somewhat increased (tab.2). The aim was to evaluate the importance of PK- and PD- information on the predictive performance, and improvement with accumulated information with an increased number of administered courses. Methods • Multiple course data of etoposide plasma concentrations and neutrophil counts were available for 44 patients from two previously published studies [2,3]. Data was analysed using NONMEM 6. BSV and BOV, including covariances, were estimated. Model performance was evaluated by goodness-of-fit plots and predictive checks. • One thousand patients receiving 5 courses of therapy were simulated from the final model. POSTHOC estimates were obtained providing either • only PK data • neutrophil baseline (BASE) • full course PD profiles • full course PK+PD profiles • from one to four previous cycles (fig.2). • The POSTHOC estimates were used as input in a set of models designed to find the dose expected to result in a nadir of 1*109 cells/L. As a reference, a standard dose reduction of 25% was used when a patient experience severe toxicity. The resulting nadir of adjusted dose when knowing the true parameters was used as outcome. Table 2.Nadir in second course of treatment after different methods of dose adjustment One reason for not seeing a more marked difference between the dosing methods is due to the relatively large estimated BOV used for simulating data. If using smaller BOV the difference become more apparent. Table 1. Predictive performance using different levels of information Fig 2. PK- and/or PD-information is used for prediction of sequential course Conclusion PK provided little benefit to predictive performance if PD information was available. The ratio of BSV/BOV is of importance in the precision of PK- or PD-guided dosing, and the etoposide model contains rather large BOV. Model-based dose individualization was shown to decrease the proportion of patients with severe toxicity despite selective dose escalation. [1] Friberg LE et al. J Clin Oncol 20:4713–4721, 2002 [2] Ratain MJ, et al:. Clin Pharmacol Ther 45:226-233, 1989 [3] Ratain MJ, et al: J Clin Oncol 9:1480-1486, 1991 Results and Discussion There was significant BSV in CL (29%), baseline neutrophil count (48%), drug effect slope factor (17%) and mean neutrophil transit time (MTT; 17%). BOV in CL (30%), slope (31%) and MTT (12%) were significant. Predictive performance when based on PD data only was similar to that of full PKPD information, and superior to the use of only PK or baseline data (tab.1). Adding information from more treatment courses improved the performance. References