Download

1 / 13
150 likes | 410 Views
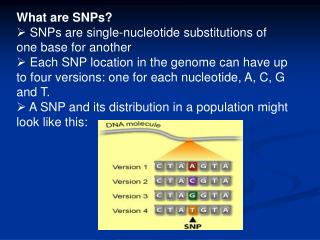
SNPs. Human Genome. SNP Typing. Allele specific hybridization ASO probes usually with the polymorphic base in a central position in the probe sequence. SNP Typing.

E N D
SNPs Human Genome
SNP Typing • Allele specific hybridization • ASO probes usually with the polymorphic base in a central position in the probe sequence
SNP Typing • minisequencing reaction or single nucleotide primer extension where the polymorphic base is determined by the addition of the ddNTP complementary to the base interrogated by a DNA polymerase. • Secondly there is the allele-specific extension where the DNA polymerase amplifies only if the primers have a perfect match with the template.
SNP Typing • Taqman: TaqMan; this assay is based in the 5’nuclease activity of Taq polymerase. When the probes are intact, the quencher interacts with the fluorophore by FRET, quenching their fluorescence. • one probe is complementary to the wild-type allele and the other to the variant allele. These probes have different fluorescent dyes attached to the 5’end and a quencher attached to the 3’ end. • In the extension step, the 5’ fluorescent dye is cleaved by the 5’ nuclease activity of the Taq polymerase, leading to an increase influorescence of the reporter dye. Mismatch probes are displaced without fragmentation.
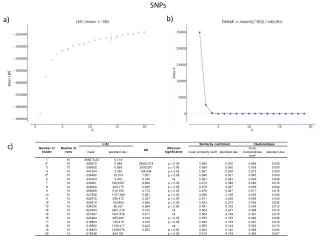
ADAM33 Astma • Linkage analysis performed using multipoint linkage: LOD score (MLS) of 2.94 near D20S906 and a second MLS of 2.94 at D20S482. • 218 nuclear families, the asthma plus BHR phenotype increased the evidence for linkage (MLS of 3.93 at D20S482, 35% excess allele sharing) and refined the candidate region to the second peak • The region spanned 4.28 centimorgans (cM) (from 9.08 cM to 13.36 cM, Fig. 1b) within markers D20S842 and D20S849. (BAC) clones were sequenced to facilitate gene identification
Identification of 40 genes • A combination of public data mining, complementary DNA (cDNA) library screening, direct cDNA selection and polymerase chain reaction with reverse transcription (RT–PCR) was used to characterize 40 genes
Association Studies • Unrelated affected offspring from families showing evidence for linkage were selected as cases. • Caucasian controls were collected in both the US and the UK in order to match the country of origin with the cases. • On average, 130 IBD-affected individuals and 217 ‘hyper-normal’ controls were compared for allele and genotype frequencies.
Adam33 • Analyses of 135 nucleotide polymorphisms (SNPs) in 23 genes spanning the 90% confidence interval revealed that the ADAM33 region showed the most significant association signal in the linkage region. • 130 kilobases (kb) to the left of ADAM33 and up to 40 kb to the right.
Adam33 • Within this ,185-kb linkage disequilibrium interval, 24 SNPs in three genes were significant in either the combined or separate US/UK analyses.The majority of these SNPs (14) were in ADAM33.