Download
1 / 20
200 likes | 394 Views
System Dynamics Modeling for Comparing Broad Strategies for Diabetes and Cardiovascular Disease. Jack Homer, PhD jhomer@comcast.net For NIH Meeting on the Role of Modeling in Comparative Effectiveness Research March 6, 2009.

E N D
System Dynamics Modeling for Comparing Broad Strategies for Diabetes and Cardiovascular Disease Jack Homer, PhD jhomer@comcast.net For NIH Meeting on the Role of Modeling in Comparative Effectiveness Research March 6, 2009 The diabetes modeling was funded by the CDC’s Division for Diabetes Translation. The CVD modeling was funded by the CDC’s Division for Heart Disease and Stroke Prevention and by NHLBI and NIH/OBSSR. Dr. Homer works as lead modeler with a team of external contractors from Sustainability Institute and RTI International.
Brief Background on SD Modeling Compartmental models resting on a general theory of how systems change (or resist change) – often in ways we don’t expect • Developed for corporate policies in the 1950s, and applied to health and health care since the 1970s • Concerned with understanding dynamic complexity • Accumulation (stocks and flows) • Feedback (balancing and reinforcing loops) • Used primarily to craft far-sighted, but empirically based, strategies • Anticipate real-world delays and resistance • Identify “high leverage” interventions • Use of diverse information sources (incl. expert judgment) and sensitivity testing Forrester JW. Industrial Dynamics. Cambridge, MA: MIT Press; 1961. Sterman JD. Business Dynamics: Systems Thinking and Modeling for a Complex World. Boston, MA: Irwin/McGraw-Hill; 2000. Homer J, Hirsch G. System dynamics modeling for public health: Background and opportunities. American Journal of Public Health 2006;96(3):452-458.
SD Model Uses and Audiences • Set Better Goals (Planners & Evaluators) • Identify what is likely and what is possible • Estimate intervention impact time profiles • Evaluate resource needs for meeting goals • Support Better Action (Policymakers) • Explore ways of combining policies for better results • Evaluate cost-effectiveness over extended time periods • Increase policymakers’ motivation to act differently • Develop Better Theory and Estimates (Researchers) • Integrate and reconcile diverse data sources • Identify causal mechanisms driving system behavior • Improve estimates of hard-to-measure or “hidden” variables • Identify key uncertainties to addressin intervention studies
Diabetes Intervention Strategy(with CDC/DDT*, 2003-07) • Diabetes programs face tough challenges and questions • With rapid growth in prevalence, is improved control good enough? • Studies show primary prevention is possible, but how much impact in practice and at what cost? • How best to balance interventions? • Model developed with program planners, diabetes researchers, and epidemiologists • Applied initially to U.S. overall, later applied to 13 different states * Done in conjunction with Sustainability Institute and the Center for Public Health Practice at Emory University Jones AP, Homer JB, Murphy DL, Essien JDK, Milstein B, Seville DA. Understanding diabetes population dynamics through simulation modeling and experimentation. American Journal of Public Health 2006;96(3):488-494.
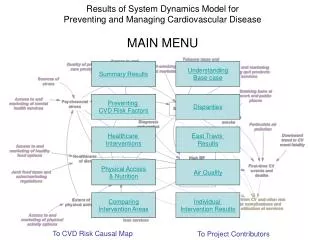
Model Overview Unhealthy days & costs from diabetes The model also subdivides the diabetes and prediabetes population stocks into stocks of diagnosed and undiagnosed (not shown here). Unhealthy days & costs per person with diabetes Diabetes prevalence Prediabetes onset Diabetes onset Complications onset People with People with Death People with People with Normal Complicated Uncomplicated Prediabetes Glycemic Diabetes Diabetes Levels Recovery Diabetes detection and management Obesity prevalence Prediabetes detection and management Black & Hispanic fractions Elderly fraction
Comparing and Combining Strategies U.S. Morbidity from Diabetes Simulated 1980-2050 600 Status Quo* 500 Control Primary prevention Monthly Unhealthy Days from Diabetes per Thousand 400 Combination 300 * Status Quo assumptions for post-2005: (1) Obesity plateauing per CDC Obesity model projection; (2) Age and ethnicity per Census projection; (3) Health insurance and non-diabetes death rates unchanging; (4) Disease management unchanging 200 1980 1990 2000 2010 2020 2030 2040 2050 With a combination of improved control and aggressive primary prevention (obesity, prediabetes), growth in the burden of diabetes could be limited for the next 10 years and for decades beyond.
Cardiovascular Disease Intervention Strategy(with CDC and NIH, 2007-11) • What are the key pathways of CV risk, and how do these affect health outcomes and costs? • How might interventions affect the risk factors and outcomes in the short- and long-term? • How might policy efforts be better balanced given limited resources? The CDC has partnered on this project with the Austin (Travis County), Texas, Dept. of Health and Human Services. The model is calibrated to represent the overall US, but is informed by the experience and local data of the Austin team. Homer J, Milstein B, Wile K, Pratibhu P, Farris R, Orenstein D. Modeling the local dynamics of cardiovascular health: risk factors, context, and capacity. Preventing Chronic Disease 2008;5(2). Available at http://www.cdc.gov/pcd/issues/2008/apr/07_0230.htm Homer J, Milstein B, Wile K, Trogdon J, Huang P, Labarthe D, Orenstein D. Simulating and evaluating local interventions to improve cardiovascular health. In submission to Preventing Chronic Disease.
Data Sources for CVD Model • Census • AHA & NIH statistical reports • National Health and Nutrition Examination Survey (NHANES) • Behavioral Risk Factor Surveillance System (BRFSS) • Diet, physical activity, primary care use, stress • Medical Examination Panel (MEPS) / National Health Interview (NHIS) • Non-CV costs attributable to smoking, obesity, hypertension, and diabetes • Research literature: risk calculators, relative risks, costs • Expert judgment (CDC and Austin) • Plausible improvements in healthy behaviors and utilization of services • Effect sizes of social marketing • Effect sizes of behavioral services • Relative risks of stress for hypertension and smoking
Base Case Trajectories 1990-2040 0.3 1 0.3 Stress Prevalence Use of Primary Care Services 0 0 Smoking Prevalence 0.6 0 30 mcg per m3 Particulate Air Pollution PM2.5 Secondhand Smoke Exposure 0 0 1.5 Uncontrolled CV event fatality multiplier 0 Prevalences 0.8 0.6 Poor Diet Fraction High cholesterol 4 0.4 CVD Deaths per 1000 0 0.3 Obesity Prevalence 0 High BP 0 Diabetes Age 65+ fraction of the population 0 0 3,000 0.8 CVD & Risk factor costs per capita Inadequate Physical Activity 0 0
4 Base Case 1) Primary Care 3) + Nutrition, Physical Activity, and Stress 2 Deaths from CVD per 1000 2) + Smoking & Air Quality Deaths if all risk factors = 0 0 2040 1990 2000 2010 2020 2030 Impacts of 3 Strategies: CVD Deaths(Strategy clusters layered in cumulatively) Clusters 1 & 2 reduce deaths quickly, Cluster 3 more gradually
Planned Extensions – Next 2 Years Potential value (better health, lower cost) from • Treating borderline conditions (pre-hypertension, borderline cholesterol, pre-diabetes) • Focusing on prevention of recurrent events • Focusing on acute and rehab care • Further reducing control targets for blood pressure, cholesterol, blood glucose • Targeting other risk factors; e.g., excess salt, low vitamin D, periodontal disease • Targeting particular age-gender subgroups • Targeting African American or Hispanic populations NHLBI feels this analysis will help them set research priorities and extrapolate from clinical trials. It will allow comparative effectiveness analysis in a broader sense of the term.
Other Diabetes & CVD Intervention Models System Dynamics: Diabetes, Heart Failure Homer J, Hirsch G, et al. Models for collaboration: how system dynamics helped a community organize cost-effective care for chronic illness. System Dynamics Review 2004; 20(3):199-222. Markov: Diabetes, Coronary Heart Disease The CDC Diabetes Cost-Effectiveness Group (Hoerger TJ, Richter A, et al.) Cost-effectiveness of intensive glycemic control, intensified hypertension control, and serum cholesterol level reduction for Type 2 diabetes. JAMA 2002; 287(19):2542-2551. Vijan S, Hofer TP, Hayward RA. Estimated benefits of glycemic control in microvascular complications in Type 2 diabetes. Annals of Internal Medicine 1997; 127(9):788-795. Weinstein MC, Coxson PG, et al. Forecasting coronary heart disease incidence, mortality, and cost: the coronary heart disease policy model. American J Public Health 1987; 77(11):1417-1426. Micro-simulation (Archimedes): Diabetes, CVD Eddy DM, Schlessinger L. Archimedes: a trial-validated model of diabetes. Diabetes Care 2003; 26(11):3093-3101. Kahn R, Robertson RM, et al. The impact of prevention on reducing the burden of cardiovascular disease. Circulation 2008; 118(5):576-585. Statistical/Monte Carlo: Coronary Heart Disease Kottke TE, Gatewood LC, et al. Preventing heart disease: is treating the high risk sufficient? J Clinical Epidemiology 1988; 41(11):1083-1093.