Download

1 / 27
270 likes | 427 Views
Core State PCH Indicators: A Preliminary Report of Multi-State Findings Using Data from the BRFSS. CDR Lauren B. Zapata, PhD , MSPH Division of Reproductive Health, CDC. Core State PCH Indicators. Effort to improve data and surveillance activities to monitor women’s PCH

E N D
Core State PCH Indicators: A Preliminary Report of Multi-State Findings Using Data from the BRFSS CDR Lauren B. Zapata, PhD , MSPH Division of Reproductive Health, CDC
Core State PCH Indicators • Effort to improve data and surveillance activities to monitor women’s PCH • 45 indicators were collaboratively identified by a committee from 7 states • CA, DE, FL, MI, NC, TX and UT • Published in MCHJ Feb 2011
BRFSS Overview • State-based system of telephone health surveys • Designed to gather information on • Health risk behaviors, clinical preventive health practices, and health-care access • Women & men 18+ years living in households • General population of reproductive age women (18-44) • For many states, only source of timely data
BRFSS Overview • Data collected monthly in all 50 states, DC & US territories • 430,000+ adults were interviewed in 2010 • States use data to: • Identify emerging health problems • Establish and monitor health objectives • Develop and evaluate programs and policies • http://www.cdc.gov/brfss
Purpose • Present preliminary descriptive data from a multi-state, comprehensive report summarizing the full set of PCH indicators • MMWR Surveillance Summary – Jan 2012 • Several data systems: • BRFSS, PRAMS, ASEC, NSTD, NVSS
Purpose • Present preliminary descriptive data from a multi-state, comprehensive report summarizing the full set of PCH indicators • MMWR Surveillance Summary – Jan 2012 • Several data systems: • BRFSS, PRAMS, ASEC, NSTD, NVSS
Study Questions • What is the prevalence of select PCH indicators? • Do they vary by state or by select demographic characteristics?
Methods • 2009 BRFSS data from 50 states & DC • Non-pregnant women aged 18-44 years • Prevalence of select core state PCH indicators for U.S., by state, and stratified by age and race/ethnicity • Analyses conducted using SUDAAN and weighted to provide unbiased national and state estimates
Access to Health CarePercentage of Women Who Currently Have Some Type of Health Care Coverage Non-Pregnant Women Aged 18-44 years, BRFSS, 200909
Utilization of Health CarePercentage of women who had a routine checkup in the past year Non-Pregnant Women Aged 18-44 years, BRFSS, 200909
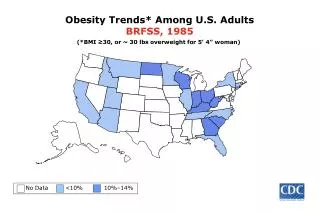
Overweight & ObesityPercentage of women who are overweight or obese based on BMI >= 25 kg/m2 Non-Pregnant Women Aged 18-44 years, BRFSS, 200909
DiabetesPercentage of women ever been told by a health care provider that they had diabetes, not including GDM Non-Pregnant Women Aged 18-44 years, BRFSS, 200909
Access to Health CarePercentage of Women Who Currently Have Some Type of Health Care Coverage
Utilization of Health CarePercentage of women who had a routine checkup in the past year
Overweight & ObesityPercentage of women who are overweight or obese based on BMI >= 25 kg/m2
DiabetesPercentage of women ever been told by a health care provider that they had diabetes, not including GDM
Conclusions • Data provide a brief and preliminary glimpse into a forthcoming CDC surveillance summary • Findings document variations by state and demographic characteristics • Findings document need for further efforts to improve women’s PCH status
Implications • Data on the core state PCH indicators can be used by states to: • Identify needs • Set priorities • Evaluate implementation and impact of PCH-related policies and initiatives • States can also use the data to compare their indicators with other states
THANK YOU! Contact Information: Lauren Zapata lzapata@cdc.gov
Challenges • Increased use of cellular telephones • Increased use of call-screening devices • Decreased # of land-line telephones • Availability of the “Do Not Call Registry” • Societal concerns about privacy • Population diversity
Strengths of BRFSS • Indicators can be monitored over time • Findings are state-representative • Data can be combined to generate national estimates • Data are timely • Allows comparisons between states • Availability of online query system
Limitations of BRFSS • Data are self-reported • Response rates are generally low and declining • Online query system does allow 2-level stratification of indicators