Download
1 / 16
170 likes | 321 Views
Graphs of Sine and Cosine. Warm Up Evaluate. 1 . 2. 3. 4. 0.5. 0. 0.5. Find the measure of the reference angle for each given angle. 5. 145°. 5. 317°. 35°. 43°. Objective. Recognize and graph periodic and trigonometric functions.

E N D
Warm Up Evaluate. 1.2. 3. 4. 0.5 0 0.5 Find the measure of the reference angle for each given angle. 5. 145° 5. 317° 35° 43°
Objective Recognize and graph periodic and trigonometric functions.
Periodic functions are functions that repeat exactly in regular intervals called cycles. The length of the cycle is called its period. Examine the graphs of the periodic function and nonperiodic function below. Notice that a cycle may begin at any point on the graph of a function.
Example 1A: Identifying Periodic Functions Identify whether each function is periodic. If the function is periodic, give the period. The pattern repeats exactly, so the function is periodic. Identify the period by using the start and finish of one cycle. This function is periodic with a period of .
Example 1B: Identifying Periodic Functions Identify whether each function is periodic. If the function is periodic, give the period. Although there is some symmetry, the pattern does not repeat exactly. This function is not periodic.
Check It Out! Example 1 Identify whether each function is periodic. If the function is periodic, give the period. a. b. periodic; 3 not periodic
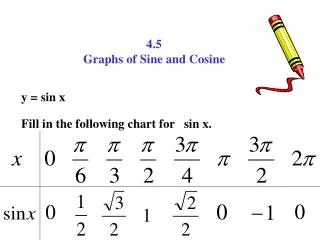
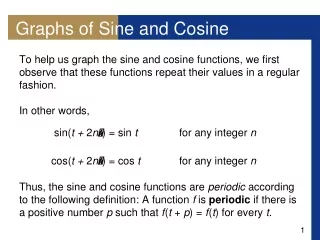
The trigonometric functions that you studied in Chapter 13 are periodic. You can graph the function f(x) = sin x on the coordinate plane by using y-values from points on the unit circle where the independent variable x represents the angle θin standard position.
Similarly, the function f(x) = cosx can be graphed on the coordinate plane by using x-values from points on the unit circle. The amplitude of sine and cosine functions is half of the difference between the maximum and minimum values of the function. The amplitude is always positive.
Using f(x) = sin x as a guide, graph the function g(x) = Identify the amplitude and period. Because the amplitude is Because the period is Example 1: Stretching or Compressing Functions Sine and Cosine Functions Step 1 Identify the amplitude and period.
The curve is vertically compressed by a factor of horizontally stretched by a factor of 2. The maximum value of g is , and the minimum value is . Example 1 Continued Step 2 Graph.
Using f(x) = cosx as a guide, graph the function h(x) = Identify the amplitude and period. Because the amplitude is Because b = 2, the period is Example 2 Step 1 Identify the amplitude and period.
The maximum value of his , and the minimum value is . Example 2 Continued Step 2 Graph. The curve is vertically compressed by a factor of and horizontally compressed by a factor of 2.