Download
1 / 35
360 likes | 526 Views
The Advanced Baseline Imager (ABI) on GOES-R. Tim Schmit NOAA/NESDIS/STAR (formerly ORA) Advanced Satellite Products Branch (ASPB) Madison, WI W. Paul Menzel, James Gurka, Mathew M. Gunshor and many others. 2nd Annual AMS Symposium Future National Operational

E N D
The Advanced Baseline Imager (ABI) on GOES-R Tim Schmit NOAA/NESDIS/STAR (formerly ORA) Advanced Satellite Products Branch (ASPB) Madison, WI W. Paul Menzel, James Gurka, Mathew M. Gunshor and many others 2nd Annual AMS Symposium Future National Operational Environmental Satellites Wednesday, Feb 1, 2006 UW-Madison
Overview • Overview • ABI • Select Products • Possible scan scenarios • Fixed Grid Format • Summary • More information
Limitations of Current GOES Imagers • Regional/Hemispheric scan conflicts • Low spatial resolution • Missing spectral bands • Eclipse and related outages GOES-R addresses the first 3 limitations, while GOES-N addresses the data outage issues.
Aerosol Detection Surface Albedo Dust/Aerosol Aerosol Particle Size Surface Emissivity Probability of Rainfall Suspended Matter Vegetation Fraction Rainfall Potential Volcanic Ash Vegetation Index Rainfall Rate Aircraft Icing Threat Currents Atmospheric Vertical Moisture Profile Cloud Imagery Ocean Color Atmospheric Vertical Temperature Profile Cloud & Moisture Imagery Ocean Optical Properties Capping Inversion Information Cloud Base Height Ocean Turbidity Derived Stability Indices Cloud Layers / Heights & Thickness Sea & Lake Ice / Displacement & Direction Moisture Flux Cloud Ice Water Path Sea & Lake Ice / Age Pressure Profile Cloud Liquid Water Sea & Lake Ice / Concentration Total Precipitable Water Cloud Optical Depth Sea & Lake Ice / Extent & Characterization Total Water Content Cloud Particle Size Distribution Sea & Lake Ice / Extent & Edge Clear Sky Masks Cloud Top Phase Sea & Lake Ice / Surface Temp Radiances Cloud Top Height Absorbed Shortwave Radiation Sea & Lake Ice / Motion Cloud Top Pressure Downward Longwave Radiation Sea & Lake Ice / Thickness Cloud Top Temperature Downward Solar Insolation Ice Cover / Landlocked Cloud Type Reflected Solar Insolation Snow Cover Convection Initiation Upward Longwave Radiation Snow Depth Enhanced "V"/Overshooting Top Detection CO Concentration Sea Surface Temps Hurricane Intensity Ozone Total Energetic Heavy Ions Imagery: All-Weather / Day - Night SO2 Detection Mag Electrons & Protons: Low Energy Lightning Detection Derived Motion Winds Mag Electrons & Protons: Med & High Energy Low Cloud & Fog Microburst Wind Speed Potential Solar & Galactic Protons Turbulence Fire / Hot Spot Imagery Solar Flux: EUV Visibility Flood / Standing Water Solar Flux: X-Ray Geomagnetic Field Solar Imagery: X-Ray Land Surface (Skin) Temperature ABI – Advanced Baseline Imager HES – Hyperspectral Environmental Suite SEISS – Space Env. In-Situ Suite SIS – Solar Instrument Suite GLM – GOES Lightning Mapper Magnetometer GOES-R Observational Requirements
Advanced Baseline Imager (ABI) • ITT Industries has been selected to build the ABIs • Completed a successful System Preliminary Design Review (December 2005) Full Disk with stepped-edge
ABI Current Spectral Coverage 16 bands 5 bands Spatial resolution 0.64 mm Visible 0.5 km Approx. 1 km Other Visible/near-IR 1.0 km n/a Bands (>2 mm) 2 km Approx. 4 km Spatial coverage Full disk 4 per hour Every 3 hours CONUS 12 per hour ~4 per hour Mesoscale Every 30 sec n/a Visible (reflective bands) On-orbit calibrationYes No The Advanced Baseline Imager:
Approximate spectral and spatial resolutions of US GOES Imagers Visible Box sizes represent detector sizes Near-IR 8 4 2 “MSI mode” Infrared
Visible and near-IR channels on the ABI Snow, Phase Part. size Cirrus Veg. Haze Clouds The ABI visible and near-IR bands have many uses.
While there are differences, there are also many similarities for the spectral bands on MET-8 and the Advanced Baseline Imager (ABI). Both the MET-8 and ABI have many more bands than the current operational imagers.
Three-color composite (0.64, 1.6 and 11 µm) shows the low cloud over the snow and the water versus ice clouds. Snow Low cloud
Volcanic Ash Plume: 11-12 and 8.5-11 μm images UW/CIMSS One day after the Mt. Cleveland eruption 20 February 2001, 8:45 UTC Simulated ABI (11-12 μm) Simulated ABI (8.5-11 μm) Poster…Ellrod
GOES-R ABI will detect SO2 plumes Water Vapor Band Difference convolved from AIRS data sees SO2 plume from Montserrat Island, West Indies SO2 Plume Current GOES Imager No skill in monitoring Current GOES Imager can not detect SO2 ABI 7.34 μm – 13.3 μm
GOES-R and GOES-I/M Simulations of Southern California Fires GOES-12 Simulated 3.9 micron Data Padua/Grand Prix Fires Date: 27-Oct-03 Time: 09:50 UTC GOES-R Simulated 3.9 micron Data Padua/Grand Prix Fires Date: 27-Oct-03 Time: 09:50 UTC Brightness Temperature (K) 12
Mountain Waves in WV channel (6.7 µm) 7 April 2000, 1815 UTC Simulated ABI Actual GOES-8 Mountain waves over Colorado and New Mexico were induced by strong northwesterly flow associated with a pair of upper-tropospheric jet streaks moving across the elevated terrain of the southern and central Rocky Mountains. The mountain waves appear more well-defined over Colorado; in fact, several aircraft reported moderate to severe turbulence over that region. Both images are shown in GOES projection. UW/CIMSS
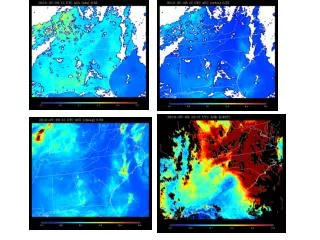
5 March 2001 - Nocturnal Fog/Stratus Over the Northern Plains “ABI” 4 minus 11 μm Difference ABI image (from MODIS) shows greater detail in structure of fog.
5 March 2001 - Nocturnal Fog/Stratus Over the Northern Plains GOES-10 4 minus 11 μm Difference ABI image (from MODIS) shows greater detail in structure of fog.
Proxy data demonstration • MSG/SEVIRI data used • Similar bands on the ABI • Improved (compared to current GOES) temporal and spatial resolutions • Dust product demonstration included • Additional simulations will be part of the AWG (Algorithm Working Group) effort
Aerosol/Dust Optical Thickness Retrieval Using ABI Results from SEVIRI@EUMETSAT
“0.47m” “0.64m” “0.86m” “1.38m” “1.61m” “2.26m” “3.9m” “6.19m” “6.95m” “7.34m” “8.5m” “9.61m” “10.35m” “11.2m” “12.3m” “13.3m” Using MODIS, MET-8 and AIRS to simulate the spectral bands on the Advanced Baseline Imager (ABI)
“0.47m” “0.64m” “0.86m” “1.38m” “1.61m” “2.26m” “3.9m” “6.19m” “6.95m” “7.34m” “8.5m” “9.61m” “10.35m” “11.2m” “12.3m” “13.3m” Similar bands on the GOES-12 Imager
“0.47m” “0.64m” “0.86m” “1.38m” “1.61m” “2.26m” “3.9m” “6.19m” “6.95m” “7.34m” “8.5m” “9.61m” “10.35m” “11.2m” “12.3m” “13.3m” Using MODIS, MET-8 and AIRS to simulate the spectral bands on the Advanced Baseline Imager (ABI) Aerosols Vegetation Cirrus Clouds Particle size Snow Upper-level SO2 Cloud phase Total Ozone Water Vapor Low-level Moisture Surface features
Current GOES scans 5 times slower than the ABI There are two anticipated scan modes for the ABI: - Full disk images every 15 minutes + CONUS images every 5 minutes + mesoscale. or - Full disk every 5 minutes.
ABI can offer Continental US images every 5 minutes for routine monitoring of a wide range of events (storms, dust, volcanoes, fires, hurricanes, etc). This is only every 15 or 30 minutes with the current GOES the routine mode.
“Franklin” Mesoscale images every 30 seconds for rapidly changing phenomena (thunderstorms, hurricanes, fires, etc). Current GOES can not offer these rapid scans while still scanning other important regions
Draft GOES-R 3-hour schedule for the ABI MSS = Mesoscale Scans from the ABI CONUS = Continental US FD = Full imaging disk scan This is a combination of mode 3 (“Flex” and mode 4 “Continuous Full Disk”).
Fixed Grid Format • The distributed, calibrated and navigationally corrected image data will be rectified [re-grid] to a fixed grid. The grid is defined relative to an ideal geostationary satellite viewpoint centered and fixed above the equator. The image pixels will have an angular separation in both the East/West and North/South directions of: • 14 microradians (0.5 km) in the 0.64 micron channel, • 28 microradians (1 km) in the 0.47, 0.86 and 1.61 um channel, • 56 microradians (2 km) in all other channels.
Summary The great amount of information from the GOES-R ABI will offer a continuation of current products and services. These products, based on validated requirements, will cover a wide range of phenomena. This includes applications relating to: weather, ocean, land, climate, and hazards. The ABI improves over the current GOES Imager the spectral, temporal, spatial and radiometric performance. The Advanced Baseline Imager (ABI), along with the Hyperspectral Environmental Suite (HES), and the Geostationary Lightning Mapper (GLM) on GOES-R will enable much improved monitoring compared to current capabilities.
More information -- ABI • AMS BAMS article by Schmit et al. from August 2005 • ABI Research Home page: • http://cimss.ssec.wisc.edu/goes/abi/ • NOAA GOES-R page: • https://osd.goes.noaa.gov/ • GOES and MODIS Galleries: • http://cimss.ssec.wisc.edu/goes/misc/interesting_images.html • http://www.ssec.wisc.edu/~gumley/modis_gallery/ • ABI Documentation from NASA: • http://goespoes.gsfc.nasa.gov/abihome.htm • ABI Simulated Spectral Response functions: • ftp://ftp.ssec.wisc.edu/ABI/SRF