Download
1 / 59
590 likes | 727 Views
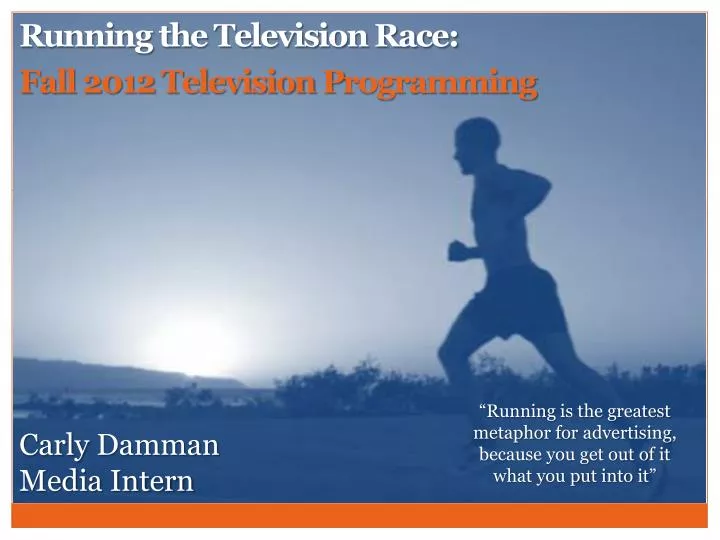
Carly Damman Media Intern. Running the Television Race: Fall 2012 Television P rogramming. “Running is the greatest metaphor for advertising, because you get out of it what you put into it”. 26.2 Miles : Running for the GOLD. Scoping out the Competition Success of Networks Y2Y

E N D
Carly DammanMedia Intern Running the Television Race: Fall 2012 Television Programming “Running is the greatest metaphor for advertising, because you get out of it what you put into it”
26.2 Miles: Running for the GOLD • Scoping out the Competition • Success of Networks Y2Y • Disqualified • Cut Shows • Qualifiers • New Shows • Starting Line • Fall 2012 Broadcast Line-up • 5 Miles • Predictions • 10 Miles • Cable Network Highlights • 15 Miles • Traditional TV Sources • 20 Miles • Rise of Online TV • 25 Miles • DVR Trends • Finish Line • Ad Spending • Water Breaks • Quiz Questions
Scoping Out the Competition: Success of Networks Year to Year
Success of Networks Year to Year:Who will finish on top? #1 2010/2011: 10, 456,000 2011/2012: 10, 348,000 % Change: -1% #2 2010/2011: 8,708,000 2011/2012: 7,908,000 % Change:-9% #3 2010/2011: 6,785,000 2011/2012: 7,814,000 % Change:+15% #4 2010/2011: 7,917,000 2011/2012: 7,689,000 % Change:-3% #5 2010/2011: 1,760,000 2011/2012: 1,485,000 % Change:-16% Source: Marc Berman’s data, P2+
Disqualified: Cut Shows
Cut Shows:Runners Who Didn’t Qualify A Gifted Man CSI: Miami How To Be A Gentleman NYC 22 Rob! Alcatraz Allen Gregory Breaking In The Finder I Hate My Teenage Daughter Terra Nova Final Season: House Are You There, Chelsea? Awake Fear Factor Free Agents Harry’s Law Prime Suspect The Playboy Club The Firm Best Friends Forever Bent The Marriage Ref Minute to Win It Who Do You Think You Are? Fear Factor The Sing-Off Final Season: Chuck Charlie’s Angels GCB Man Up! Extreme Makeover: Home Edition Missing Pan Am The River Work It. Final Season: Cougar Town- TBS Desperate Housewives The Secret Circle Ringer H8R Final Season: One Tree Hill
Qualifiers: New Shows
New Shows:Newly Qualified Runners Elementary Vegas Partners Made In Jersey Mid-Season: Friend Me* The Job* The Golden Boy* Mid-Season: The Following* The Goodwin Games* Ben&Kate The Mindy Project Mob Doctor Nashville The Neighbors 666 Park Avenue Last Resort Mid-Season: How to Live with Parents for the Rest of Your Life* Zero Hour* The Family Tools* Red Widow* Mistresses* Malibu Country* Arrow Beauty and the Beast Emily Owens, M.D. Mid-Season: The Carrie Diaries* Cult* Mid-Season: Do No Harm* Infamous* Hannibal* 1600 Penn* Save Me* Next Caller* GoOn The New Normal Animal Practice Guys with Kids Revolution Chicago Fire *= Mid-Season
Starting Line: Fall 2012 Broadcast Line-up
Monday *Red= New Show *=new time slot
Tuesday *Red= New Show *=new time slot
Wednesday *Red= New Show *=new time slot
Thursday *Red= New Show *=new time slot
Friday *Red= New Show *=new time slot
Saturday *Red= New Show *=new time slot
Sunday *Red= New Show *=new time slot
5 Miles: Predicting the Top Finishers
Predicting the Top Finishers:The Star Athletes Ad Age’s Picks • Winners: • Nashville (ABC) • Partners (CBS) • The Following (Fox) • Losers: • Mob Doctor (Fox) • The Family Tools (ABC) • Save Me (NBC) My Picks • Winners: • Revolution (NBC) • Vegas (CBS) • 666 Park Avenue (ABC) • Losers: • Made In Jersey (CBS) • Animal Practice (NBC) • Emily Owens, M.D. (The CW)
Predicting the Top Finishers:TV Guide’s Watchlist ½ a million registered users Captures the shows receiving the most buzz so far
10 Miles: Cable Network Highlights
Cable Network Highlights:Cable vs. Broadcast Viewing Source: CAB analysis of Nielsen Npower C3 Ratings; 9/19/11-2/19/12 v. 9/20/10-2/20/11
Cable Network Highlights:Cable vs. Broadcast Reach • Is cable leveling off? • While cable penetration (wired and unwired) currently stands at approximately 90% of TV households, no individual cable network cumesto anything near that by the end of an average week. • Out of the top 20 cable networks, eight have experienced declines season-to-date with double-digit drops at ESPN, TNT, MTV and Nickelodeon. • However, smaller networks are reporting gains, showing an increase in original programming and cable network fragmentation Source: TVB TV Basics
Cable Network Highlights:Wired Cable HH’s vs. Total TV HH’s Source: TVB TV Basics
Cable Network Highlights:Top 5 Cable Networks #1 cable network for an unprecedented 6 straight years #5 in primetime deliveries of A18-34 #1 network among males 25-54 #2 network in primetime deliveries of A18-49 and #3 in A18-34 Top cable network for men in primetime
Water Break:How many years of TV will the average American watch in his/her Lifetime? A. 7 years B. 9 years C. 14 years D. 18 years
15 Miles: Traditional TV Sources
Traditional TV Sources:Americans still spend most of their time watching traditional TV Source: Nielsen Cross-Platform Report Q4 2011
Traditional TV Sources:Most Americans use wired cable but not seeing growth 2012 • Total HH’s with TV: 97.1% • Total HH’s with Cable: 59.7% • Total HH’s with Satellite: 31.2% • Total HH’s with OTA (Telco): 9.7% Source: Nielsen Cross-Platform Report Q4 2011, TVB.org
20 Miles: Rise of Online TV
Rise of Online TV:Decline of Traditional TV, growth of non-traditional Source: Nielsen Cross-Platform Report Q4 2011
Rise of Online TV:HH’s viewing TV online continue to increase
Water Break:Top Online Video Destination? Source: Nielsen State of the Media Report
Rise of Online TV:What sites are being used most often? Q1 2012 Source: Techcrunch.com
25 Miles: DVR Trends
DVR Trends:The Influence of DVR Source: CAB Timeshifting in 2012 Report
DVR Trends: Top 10 DVRed Broadcast Shows Source: Nielsen’s Npower; Prime=M-Sa 8-11p & Su 7pm. Base= DVR HHs;2/1-2/26/12; Broadcast 6; A18-49 total U.S. Live+7rank (greater or equal to 2 t/c). Based on 2011-2012 Season
Finish Line: Ad Spending
Ad Spending:Advertising & Audiences-Primetime by Genre Source: Nielsen; Nielsen State of the Media
Ad Spending:Advertisers still spend more on Network vs. Cable • Source: Kantar Media