Download
1 / 18
320 likes | 540 Views
ANALYST 3Q – Power Quality Analyser Functions – User Interface. Control Elements. Cursor control Save screen-shots, confirm entries Call menus, next level. Measurement start/stop Toggle measurement/ recording mode Activate CURSOR Display-backlight ON/OFF.

E N D
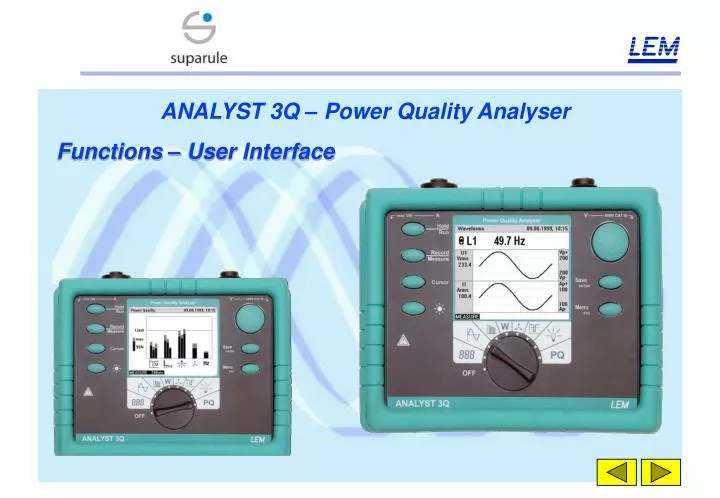
ANALYST 3Q – Power Quality Analyser Functions – User Interface
Control Elements Cursor control Save screen-shots, confirm entries Call menus, next level Measurement start/stop Toggle measurement/ recording mode Activate CURSOR Display-backlight ON/OFF Rotary switch for selection of measurement function
User Interface – SETUP • Use menus (button Menu/Esc) for settings: • Recordings - Averagingtime (recording period), threshold for events (dips, swells) • Memory - recall/delete screens • Display contrast • Instrument-SETUP - Ratios for CTs/PTs • info about instrument, backlight • Mains system - Star/delta, nominal voltage, frequency • Date/time • Language - German, English, French, Spanish, Italian
User Interface – SETUP Examples:
Accumulators Mains operation User Interface – Display-Symbols Power supply Measurement functionDate / time Status Measure Record Change with: RECORD SAVE Measurement pause Recording pause Activate with: HOLD RUN Menu On/off with: MENU ESC Display recorded data
User Interface – Function Selection • Easy operation: • Select measuring function with rotary switch • Connect test leads • Read off test results
PQ – Power Quality • Normalised bar diagram for actual voltage quality parameters: • Voltage variations • Events • Harmonics • Flicker • Unbalance • Mains frequency • Quick View – instant display • EN50160 – with 10 minute intervals
PQ – Power Quality • One bar for each phase L1, L2, L3 • Bars are normalised to appropriate limit – assessment of power quality at once • Adjustable limits (SETUP) • HOLD/RUN – • Freezes actual display • SAVE/ENTER • Saves screen shot to internal memory
Digital Display of U, I, F • Digital display of RMS values of : • voltage U • current I • mains frequency F • U, I of each phase L1, L2, L3 additionally • maximum- and minimum value • HOLD/RUN freezes the actual display • SAVE/ENTER saves screen shot to internal memory
Digital Display of U, I, F Recording of RMS values versus time (recorder mode) Configuration of recorder mode via SETUP RECORD/MEASURE toggles between recording and measurement mode Precise evaluation of time diagrams with cursor in HOLD-mode
Waveforms • Oscilloscope diagram of the waveform of current and voltage of each phase: • Voltage U of L1, L2, L3 • Current I of L1, L2, L3 • over one mains period • Digital display of range and mains frequency • HOLD/RUN freezes actual display • SAVE/ENTER saves screen shot to internal memory
Harmonics • Bar type diagram of the harmonics of the three phases: • Voltage H1- H40 • Current H1-H40 • Digital display of • THD, rms values of mains voltages and harmonics, percentage • HOLD/RUN freezes actual display, evaluation of harmonics with cursor in HOLD-mode • SAVE/ENTER saves screen shot to internal memory
W - Power • Digital display of: • active power P, Ptot • apparent power S • reactive power Q • distortion power D • power factor PF, capacitive/inductive • voltage U • current I • mains frequency
W - Power HOLD/RUN freezes actual display SAVE/ENTER saves screen shot to internal memory RECORD/MEASURE activates recorder mode with adjustable averaging time/recording period, data analysis with cursor in HOLD-mode
Unbalance • Representation of phase voltages in a vector diagram : • voltage • Phase angle • Digital display of • RMS value of UL1, UL2, UL3 • phase angle • HOLD/RUN freezes the actual display • SAVE/ENTER saves screen shot to internal memory
Events • Recording of voltage-time diagrams of the phase where the event occurred: • voltage dip • voltage swell • voltage interruption • MENU/ESC: Define thresholds • HOLD/RUN freezes actual display, start neww measurement • SAVE/ENTER saves screen shot to internal memory • Browsing of events on screen
Flicker – Fl, Pst, Plt • Display of flicker intensity of L1, L2, L3: • Instant value Fl • Short time flicker Pst • (10min-average values) • Long time flicker Plt • (2 hours = 12x10min-average values) • Minimum-, maximum-values • Time diagrams (recorder mode)
Flicker – Fl, Pst, Plt • HOLD/RUN freezes actual display, starts a new evaluation • SAVE/ENTER saves screen shot to internal memory • RECORD/MEASURE activates recorder mode – • 2 display modes: • Fl and Pst or • Fl and Plt • Data analysis with cursor in HOLD-mode