Download
1 / 102
1.02k likes | 1.2k Views
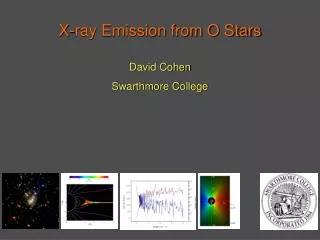
X-ray Spectral Diagnostics of Activity in O and Early-B Stars. David Cohen Swarthmore College. wind shocks and mass-loss rates. Scope. X-ray emission from normal, effectively single and non-magnetic O and early-B stars

E N D
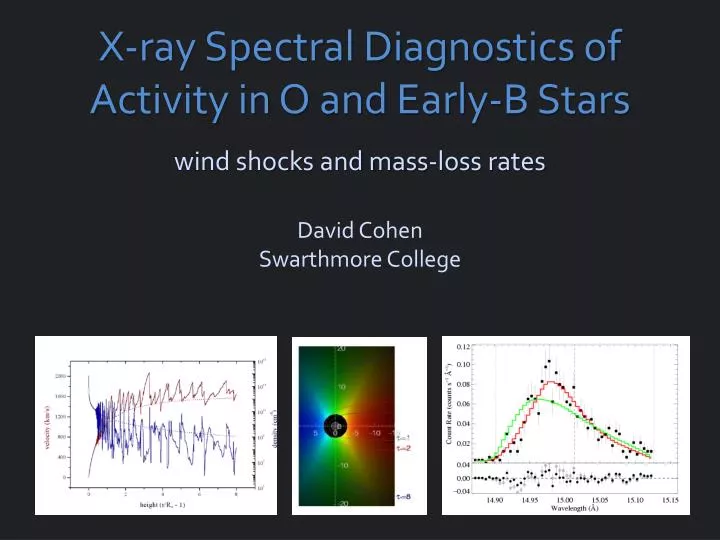
X-ray Spectral Diagnostics of Activity in O and Early-B Stars David CohenSwarthmore College wind shocks and mass-loss rates
Scope • X-ray emission from normal, effectively single and non-magnetic O and early-B stars • What does it tell us about high-energy process and about the winds on these stars?
Goal • To go from the observed X-ray spectra to a physical picture: • Kinematics and spatial distribution of the > 1,000,000 K plasma • Column-density information that can be used to measure the mass-loss rate of these winds
aside • The X-rays are quite time-steady, but the underlying processes are highly dynamic – activity
Theory & numerical simulations Excited by turbulence imposed at the wind base Self-excited instability Owocki, Cooper, Cohen 1999 Feldmeier, Puls, Pauldrach 1997
Vshock ~ 300 km/s : T ~ 106 K shock onset at r ~ 1.5 Rstar Shocked wind plasma is decelerated back down to the local CAK wind velocity
The paradigm • Shock-heated, X-ray emitting plasma is distributed throughout the wind, above some onset radius (Ro) • The bulk of the wind (~99%) is unshocked, cool (T < Teff) and X-ray absorbing (t*) There are different types of specific models within this paradigm, and many open questions
More realistic 2-D simulations: R-T like break-up; structure on quite small scales Dessart & Owocki 2003, A&A, 406, L1
Morphology Pup (O4 If) Capella(G5 III) – coronal source – for comparison
Chandra HETGS (R < 1000) Pup (O4 If) Capella(G5 III) – coronal source – for comparison
Ne IX Fe XVII Ne X Morphology – line widths Pup (O4 If) Capella(G5 III) – coronal source – for comparison
Ne IX Fe XVII Ne X Morphology – line widths Pup (O4 If) ~2000 km/s ~ vinf Capella(G5 III) – coronal source – for comparison
Pup (O4 If) Capella(G5 III) – unresolved
Ro Profile shape assumes beta velocity law and onset radius, Ro
Universal property of the wind zdifferent for each point
Pup (O4 If) Capella(G5 III) – unresolved
= 1 contours t=1,2,8 Ro=1.5 Ro=3 j ~ 2 for r/R* > Ro = 0 otherwise Ro=10 key parameters: Ro &t*
We fit these x-ray line profile models to each line in the Chandra data Fe XVII Fe XVII
And find a best-fit t* and Ro… t* = 2.0 Ro = 1.5 Fe XVII Fe XVII
…and place confidence limits on these fitted parameter values 68, 90, 95% confidence limits
Let’s focus on the Ro parameter first Note that for b = 1, v = 1/3 vinf at 1.5 R*v = 1/2 vinf at 2 R*
Distribution of Ro values in the Chandra spectrum of z Pup Consistent with a global Ro = 1.5 R*
Vinf can be constrained by the line fitting too Vinf from UV (2250 km/s) 68% conf. range for fit to these five points
Kinematics conclusions • Line widths and shapes are consistent with : • X-ray onset radius of ~ 1.5 R* • Same b, vinf as the bulk, cold wind
Wind Absorption CNO processed • Next, we see how absorption in the bulk, cool, partially ionized wind component affects the observed X-rays Solar opacity
opacity of the cold wind wind mass-loss rate t*is the key parameter describing the absorption wind terminal velocity radius of the star
Wind opacity • X-ray bandpass ISM wind
Wind opacity • X-ray bandpass Chandra HETGS
X-ray opacity CNO processed appropriate to z Pup • Zoom in Opacity is bound-free, inner-shell photoionization Major ionization edges are labeled Solar
This is the same Fe XVII line we saw a minute ago t* = 2.0 Ro = 1.5 Fe XVII Fe XVII
t* = 2 in this wind -0.2vinf +0.2vinf -0.6vinf +0.6vinf -0.8vinf +0.8vinf observer on left t= 3 optical depth contours t= 1 t= 0.3
Other lines? • Different k – and thus t* – at each wavelength
z Pup: three emission lines Mg Lya: 8.42 Å Ne Lya: 12.13 Å O Lya: 18.97 Å t* = 1 t* = 2 t* = 3 Recall:
Fits to 16 lines in the Chandra spectrum of zPup t*(l) trend consistent with k(l)
Fits to 16 lines in the Chandra spectrum of zPup CNO processed t*(l) trend consistent with k(l) Solar
Mbecomes the free parameter of the fit to the t*(l) trend t*(l) trend consistent with k(l)
Mbecomes the free parameter of the fit to the t*(l) trend t*(l) trend consistent with k(l)
Traditional mass-loss rate: 8.3 X 10⁻⁶Msun/yr From Haignoring clumping Our best fit: 3.5 X 10⁻⁶Msun/yr
Traditional mass-loss rate: 8.3 X 10⁻⁶Msun/yr Fe XVII Our best fit: 3.5 X 10⁻⁶Msun/yr