Download
1 / 11
110 likes | 205 Views
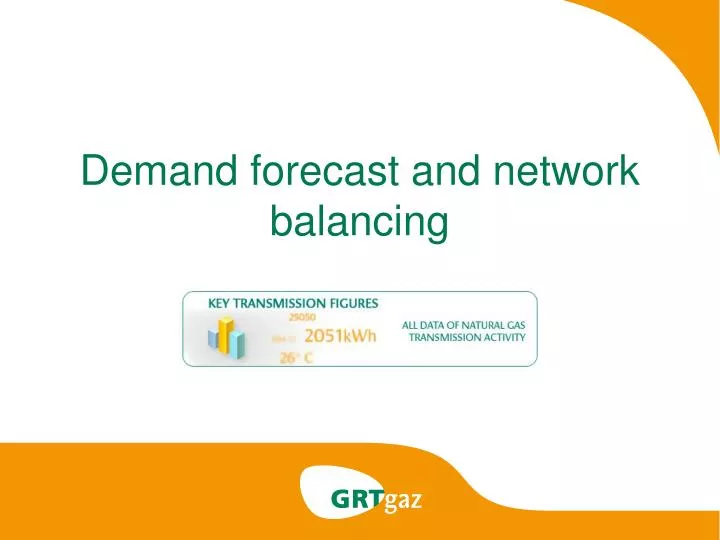
Demand forecast and network balancing. GRTgaz Network and areas (balancing zones). North Area. South Area. Consumption Forecast Publication. Day Ahead GRTgaz Forecasts – 15:30. Consumption Forecast Publication. A part of the needs. Quantity. A part of the needs. Balancing GRTgaz

E N D
GRTgaz Network and areas (balancing zones) North Area South Area
Day Ahead GRTgaz Forecasts – 15:30 Consumption Forecast Publication
A part of the needs Quantity A part of the needs Balancing GRTgaz Platform Day Ahead D-1 14:00 (Nomination) Within Day D 11:00 (Nomination) GRTgaz forecasts (T°, Historical Data…) Consumption Forecasts : Shippers and GRTgaz
Daily physical balancing need • Every day, GRTgaz performs transmission system scheduling for the next day and updates the schedule for the current day. • This scheduling process allows, especially by comparing GRTgaz’s consumption forecasts with shippers’ nominations, to establish the day-to-day status of the transmission system for day D on the South zone and the North zone. • In each of these balancing zones, if the system is forecast to be “long” (gas surplus), GRTgaz responds by selling on the balancing market. Conversely, if the system is forecast to be “short” (gas deficit), GRTgaz responds by buying on the balancing market.
Daily physical balancing need Shippers delivery Forecasts GRTgaz delivery Forecasts +/- Compute daily physical balancing need Cumulated Imbalance Account Nominations Quantity to purchase/sell by balancing zone Adjustment parameters Linepack variation
Daily physical balancing need • The quantity of gas that GRTgaz can buy or sell is capped at a maximum intervention volume per balancing zone • The balancing price generated by trading on the platform is used when billing shippers for the proportion of their own imbalances. (Calculation made with DA and WD trade sessions when existing, or calculation rules for week ends)
Monthly information report on GRTgaz’s balancing market activity Volumes
Monthly information report on GRTgaz’s balancing market activity Prices
Shippers’ Daily imbalance – Principal rules • Provisional Daily imbalance quantities calculated every day • Definitive Daily Imbalance quantities calculated M+1 • For each daily imbalance : • A part of the imbalance is tolerated • Beyond the tolerance, quantities are exposed to penalties, referring to the price from Balancing Platform