Download
1 / 28
280 likes | 400 Views
Measurement of single electron spectrum in sqrt(s)=200GeV p-p collisions at RHIC-PHENIX. 外川 学 京都大学 for the PHENIX collaboration. 日本物理学会 2004/09/29. CDF hep-ex/0408020. 動機. -> pQCD で記述される。. 単電子測定による重クォーク生成機構と破砕関数の理解 RHIC エネルギーでの pp 衝突における重クォーク生成のほとんどはグルーオンの融合過程によって生成。

E N D
Measurement of single electron spectrum in sqrt(s)=200GeV p-p collisions at RHIC-PHENIX 外川 学 京都大学 for the PHENIX collaboration. 日本物理学会 2004/09/29
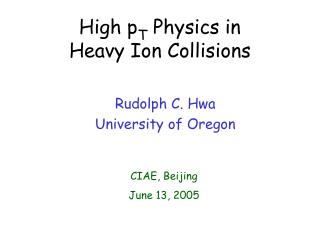
CDF hep-ex/0408020 動機 -> pQCDで記述される。 • 単電子測定による重クォーク生成機構と破砕関数の理解 • RHICエネルギーでのpp衝突における重クォーク生成のほとんどはグルーオンの融合過程によって生成。 • しかしながらTevatronにおけるD,B中間子や、STARにおけるD中間子の生成断面積が理論予測を上回るなど、未だ理解されていない。 -> PHENIXでは低いバックグラウンド状態でDやB中間子 からの崩壊粒子である単電子を測定可能。 PHENIX: PRL 88(2002)192303 NLO pQCD (M. Mangano et al., NPB405(1993)507) PHENIX ISR PYTHIA (single electron)
PHENIX detector 電磁カロリメーター RICH • 電子はセントラルアームで測定。 • 運動量測定系 • 電磁カロリメーター(EMCal) • RICH (Ring Imaging CHerenkov ) 5GeV/c以下のパイ中間子や他の荷電ハドロンと電子を分離可能 • 中間ラピディティ領域を覆う-> 高いpTの物理に特化 |h|<0.35, 0<f<p single electron 運動量測定系 (ドリフト、パッドチェンバー)
PHENIXにおける重心系エネルギー200GeVのpp衝突で生成される電子PHENIXにおける重心系エネルギー200GeVのpp衝突で生成される電子 Photonic electron spectrum for RUN3 pp by R.Averbeck • 起源 : • Non-photonic • ほとんどが重クォークを含んだ中間子からくる(D,B) • Photonic(右図) • 0,等によるダリッツ崩壊 • Photon conversion : • 検出器までの物質量による • 今回使用するデータ中ではビームパイプ、空気、シリコン検出器がある • non-photonic起源の電子を取り出す方法 cocktail subtraction method 0の寄与がほとんど +(少しのh) converter subtraction method
pT pT pT Converter subtraction method • P : photonic起源の電子の収量 • N : non-photonic起源の電子の収量 • A : non-converter data における電子の収量 • C : converter data における電子の収量 • Rsim = photonic起源のconverter dataにおける電子の収量 photonic起源のnon-converter dataにおける電子の収量 (PHENIXにおいてphotonicはp0が大部分) no converter data : A = P + N converter data: C = Rsim * P + N • P = ( C – A ) / ( Rsim – 1) N = ( Rsim * A – C ) / ( Rsim – 1) • コンバーター thin : 1.7%X0 ** All parameter have pT dependence.
Cut parameters • 物質量の均一性のためのカット • アクセプタンス内にある他の検出器により物質量が変わってしまう領域ができる。 • (物質量の均一性が保証できるとこだけ使う) • 電子同定のためのカット: • EMCal(とチェンバー系)より • エネルギー(EMCal) と 運動量(チェンバー)の比 : ~ 1 @ 電子 • チェンバーとEMCalでの位置の差分 : 電子に合わせる • EMCalで起こるシャワー分布を見る : 電子、光子を同定 • RICHより • photo-electronの数 : 5GeV/c以下の荷電ハドロンは放出しない.
データ収集状況 • ERT (Emcal Rich Trigger)によるデータ収集 • 電磁カロリメーターでのエネルギー損失とRICHのヒットを要求。高エネルギーの電子を収集するためのトリガー。 • 本実験での電磁カロリメーターの閾値 : 400MeV,800MeV • 本実験(2003年に行われた陽子衝突実験 : RUN3) • Q/Aの後、全統計 : 320nb-1 • 今回の解析では “converter subtraction method”により、 • ERT400 30nb-1 • ERT400 with thin converter run 47nb-1 とを比較。 2002年(RUN2)と比べて 統計 : ~20 nb-1 (15倍) アクセプタンス改善 : 2~3倍
アクセプタンス • アクセプタンス計算には、測定時の検出器条件を再現するよう調整されたGEANTシミュレーションにより求める。 • 4M電子事象を生成 (2M e+ and 2M e-) • 0<pt<10(GeV):flat, |eta|<0.6, 0<phi<2pi の領域でシミュレート • このアクセプタンスには電 子同定の補正も入っている。 Red : positron Blue : electron Generated and analyzed at RSCC and CCJ (RIKEN machine)
Rsim : converter/non-converter ratio (シミュレーション) Rsim pT range (8 sets): (50M pi0 for each) 0.5-, 1.0-, 1.5-, 2.0-, 2.5-, 3.0-, 4.0-, 5.0- |eta|<0.5, 0<phi<2pi, |zvtx|<30cm • Rsim : photonic成分のコンバーター有無での比。 • PHENIXでのphotonic起源はp0の生成が主。 • p0インプットのGEANTシミュレーション • RsimはpTに対してほぼ一定であり、1.98 +- 0.03 pT Generated and analyzed at RSCC and CCJ (RIKEN machine)
Electron yield N = ( Rsim * A – C ) / ( Rsim – 1) P = ( C – A ) / ( Rsim – 1) 得られたデータ点は計算ラインと一致。 Diff (data/line) Systematic error band RUN3 photonic spectrum (calculation) Green : with converter Magenta : without converter Photonic起源の電子スペクトラム non Photonic spectrum pT pT
Electron yield P = ( C – A ) / ( Rsim – 1) N = ( Rsim * A – C ) / ( Rsim – 1) PHENIX work in progress RUN2 data (cocktail subtraction method) RUN3 data (converter subtraction method) pythia sum pythia charm pythia bottom Pythia parameters <kT>=1.5 <mc>=1.25 K-factor=3.5 SPS and FNAL (charm) ISR (single e) を再現 Green : with converter Magenta : without converter non-photonic起源の電子スペクトラム Photonic spectrum pT
まとめ • RHIC pp衝突実験におけるD,B中間子の生成断面積を測定するために、その崩壊粒子である単電子の測定を行った。 • Converter subtraction methodによって得られたPhotonic起源の電子スペクトラムは計算によるものと良く一致している。 • Non-photonic起源の電子スペクトラムは cocktail subtraction methodを用いたRUN2 ppで得られたデータと良く一致している。 • 生成断面積は高いpT領域で、sqrt(s)=130GeV以下を良く再現するtuned pythiaよりも、少し大きく見えている。 • 現在使っている統計は全体の1/10。 • 今後の解析で高統計によるpT依存等を見ていく。
e yield thick Future plan thin material • RUN3での全統計を用いた解析 • 他にもthick converter のデータも有る -> 解析確認 • 更なる高いpt領域測定のためのイベント解析の研究. • 厳しめのカット : n1>=4, npe1>=7, fabs(emcsdphi_e)<2, fabs(emcsdz_e)<2 等(下図) • 次にはじまるRUNでは 最大50倍の統計量をと る予定。 • 5~10 pb-1 • 高いptでの単電子 はB中間子からが主? • 2008(予定)に入れる VTXでcharm、bottom の分離可能。 No back ground estimation Not apply parameter tune well stat. 200 nb-1
Compared with pythia (RUN2 pp) pp @ 200 GeV PHENIX Preliminary Non-photonic invariant crossection is compared with PYTHIA charm and bottom expectation PYTHIA tuned to data at lower s and extrapolated to RHIC energy PRL88(2002)192303 underpredicts data at pT>1.5 GeV/c <kT>=1.5 <mc>=1.25 K-factor=3.5 Q2 scale = 4 Charm production at SPS and FNAL Single electron data ISR -> 再現
Systematic error estimation • Systematic uncertainties in Rsim (ratio of the converter/non-converter yield for pure photonic component) • Conversion itself --- 10% (1.97 ± 0.03) • Acceptance difference between converter/non-converter run - • eID efficiency difference <1 % Total : (Added by squared) 10% • Systematic uncertainties in Acceptance && eID • Acceptance 10% ( acceptance agreement between the data and sim) • Momentum smearing <10% (this correction was not applied) • eID 2% (1/3 of total efficiency loss of 7%) • Total 14.2 % • Systematic uncertainties in luminosity • Trigger bias 3% (fBBC=0.75) • Cross section error 12% (sBBC=20.5 mb) • RUN2 : 21.8mb RUN3 : 19mb (studied value : temporary) so, now we use simple average. • Total 12.4% • Note: In the acceptance calculation, the momentum smearing correction was not applied. The correction is estimated as ~ 10% at the highest pT (4-5 GeV/c) and much smaller in the lower pT bins. In the systematic uncertainty, the maximum value of this (not applied) correction was taken as the systematic error and added in squares in the acceptance&&eID errors. • VM decay contribution …very small and ignored • Kaon decay contribution…should be a few % of the photonic component. Ignored in this analysis. • The total systematic error is determiend by adding the errors from Rsim and the errors in the acceptance,the eID efficiency and the cross section error in squares (18.8%).
emacsdphi_e emacsdz_e Parameter tune (real data) pt>1GeV/c Sigma ~ 1.06 These pictures are after parameter tune of EWG_Electron ndst. For looking tuning parameters, apply eID cut excepting itself. And these are good agreement with sigma ~ 1. These parameters were tuned by Yuji Tsuchimoto. Sigma ~ 1.16 dep pt>1GeV/c Sigma ~ 1.06
Acceptance differences between real and sim This picture is phi distribution comparing the real (black) to the simulation data (red : looking pi0 simulation result of pt > 0.5 GeV/c). Both of histograms have pt cut (more than 0.5GeV/c) and fiducial cut. From this picture, these simulations are good agreement with the data. Statistics are same, weighted mean of this ratio is 1.008
RICH cut efficiency (correction for simulation data) Since RICH response of PISA is difficult, so not tuned well now, The eID efficiency between real and simulation data is different. Next 2 figures show RICH responses (n1 and chi2/n0) of real and simulation data and estimate the difference of remaining event by these cut. This difference should correct acceptance calculation. n1 chi2/n0 with n1 cut Real : 0.984 Sim : 0.961 Ratio : 0.976 Real : 0.857 Sim : 0.817 Ratio : 0.954 pt > 0.7 GeV pt > 0.7 GeV Total difference : 0.931 +- 0.056 % -> correction for acceptance.
Acceptance difference (no-converter run vs. converter run) ERT400 ERT400 thin For checking the DC acceptance, looking charged particle ratio. chi2/ndf < 1 Stability is good. Systematic error is less than stat. error
eID efficiency difference Looking electron number / event vs. run# This fraction should be eID cut stability. Stability is : ERT400 : less than stat. error ERT400 thin conv. : adjust chi2/ndf to 1 : systematic error is 0.63% -> <1%
Acceptance calculation • Acceptance is calculated from the single electron PISA simulation with run3 setting. • Total 4M electrons (2M e+ and 2M e-) are simulated (pt is flat in 0~10GeV/c). • I calculated the acceptance correction factor as following formula, • Acc = (abs(bbcz)<20 && eID && phi cut && Fiducial cut)/(abs(bbcz)<20) (it should include eID efficiency.) • Right picture shows Acceptance as a function of pt. And red and blue are for positron and electron respectively. Difference of electron and positron is from fiducial and phi cut. Left picture shows alpha vs. phi scattering plot nowa fiducial and phi cut . Minus charged particles are alpha > 0 and plus charged particles are alpha < 0 in PHENIX. From this picture, our fiducial and phi cut is very asymmetric for charged particles. alpha vs. phi (simulation) e- F = ([0]+[1]*x)*tanh([2]*x+[3]) e+
ERT400Thin/ERT400 Thin converter period ERT400/ERT800 SOUTH NORTH ratio is defined as : N of electron / all evts in coverter period N of electron / all evts in non converter period ratio defined as : N of charged particles / all evts in one period N of charged particles / all evts in other period ERT400Thick/ERT800 ERT400Thick/ERT400 Thick converter period SOUTH NORTH ERT400Thin/ERT800 NORTH SOUTH ERT800Thick/ERT800 Thick converter period ERT800Thick/ERT800 NORTH SOUTH Phi cut DC,PC and eID stability are also checked as function of phi, and NORTH or SOUTH For Check DC and PC, this ratio should be ~1. (flat) For Check eID cut, (2 period are same EMCal threshold) This ratio should be flat.
efficiency efficiency W0 E0 momentum momentum efficiency efficiency W1 E1 momentum momentum efficiency efficiency W2 E2 momentum momentum efficiency efficiency W3 E3 momentum momentum ERT trigger efficiency correction • I analyzed EWG_Electron ndst. • The ERT trigger data was corrected by the trigger efficiency determined by Xie Wei. The efficiency function is determined for each of the EMCAL sector from a trigger simulation tuned to the real data. • The trigger efficiency function used in the analysis is show in the right figures.
Detector Spec. EMCal RICH Rejection factor : 104 for separate track
Photonic起源の電子スペクトラム • The photonic component P(pT) of the electron is determined from the converter run yield C(pT) and the no-converter yield A(pT) as • P(pT) = (C(pT)-A(pT))/(Rsim(pT)-1) Ed3N/dp3 = (1/Nevt)(1/2p)(1/pT)(1/DpT)P(pT)(1/h)/eff(pT) Ed3s/dp3 = Ed3N/dp3 / fBBC * sBBC fBBC=0.75 : sBBC= 20.5mb • Non-photonic electron yield N(pT)is determined as N(pT) = (Rsim(pT)*A(pT)-C(pT))/(Rsim(pT)-1) • The acceptance and other corrections are applied in the same ways for the photonic component. And this spectrum is already subtracted Ke3 component.
Acceptance • Eta 0.7 • Phi 0.5 -> 0.35 • Fiducial 0.7 -> 0.25 • Phi 0.6 -> 0.15
work in progress PYTHIA (best fit)