Download

1 / 12
200 likes | 485 Views
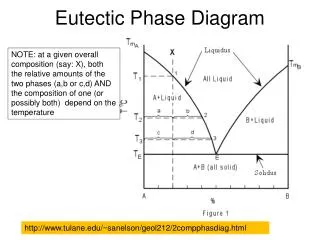
Phase Diagram. DEVELOPMENT OF MICROSTRUCTURE IN EUTECTIC ALLOYS. Depending on composition, several different types of microstructures are possible for the slow cooling of alloys belonging to binary eutectic systems. These possibilities will be considered in terms of the lead–tin phase diagram .

E N D
Phase Diagram DEVELOPMENT OF MICROSTRUCTURE IN EUTECTIC ALLOYS
Depending on composition, several different types of microstructures are possible for the slow cooling of alloys belonging to binary eutectic systems. • These possibilities will be considered in terms of the lead–tin phase diagram
Case-1 • The first case is for compositions ranging between a pure component and the maximum solid solubility for that component at room temperature [20˚C (70˚F)]. • For the lead–tin system, this includes lead-rich alloys containing between 0 and about 2 wt% Sn (for the α-phase solid solution), and also between approximately 99 wt% Sn and pure tin (for the β phase). • The alloy remains totally liquid and of composition C1 until we cross the liquidus line at approximately 330˚C, at which time the solid α phase be-gins to form.
Schematic representations of the equilibrium microstructures for a lead–tin alloy of composition C1 as it is cooled from the liquid-phase region.
Case-2 • The second case considered is for compositions that range between the room temperature solubility limit and the maximum solid solubility at the eutectic temperature. • For the lead–tin system these compositions extend from about 2 wt% Sn to 18.3 wt% Sn (for lead-rich alloys) and from 97.8 wt% Sn to approximately 99 wt% Sn (for tin-rich alloys).
Schematic representations of the equilibrium microstructures for a lead–tin alloy of composition C2 as it is cooled from the liquid phase region.
Case-3 • The third case involves solidification of the eutectic composition, 61.9 wt% Sn • As the temperature is lowered, no changes occur until we reach the eutectic temperature, 183˚C. • Upon crossing the eutectic isotherm, the liquid transforms to the two α and β phases. This transformation may be represented by the reaction
Schematic representations of the equilibrium microstructures for a lead–tin alloy of eutectic composition C3 above and below the eutectic temperature.
During this transformation, there must necessarily be a redistribution of the lead and tin components
Subsequent cooling of the alloy from just below the eutectic to room temperature will result in only minor micro structural alterations.
Case 4 • The fourth and final microstructural case for this system includes all compositions other than the eutectic that, when cooled, cross the eutectic isotherm. • The microstructural development between points j and l is similar to that for the second case • Just prior to crossing the eutectic isotherm (point l), the α and liquid phases are present having compositions of approximately 18.3 and 61.9 wt%